In This Topic
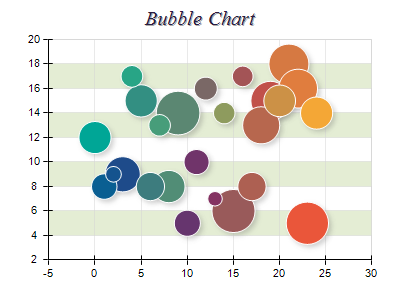
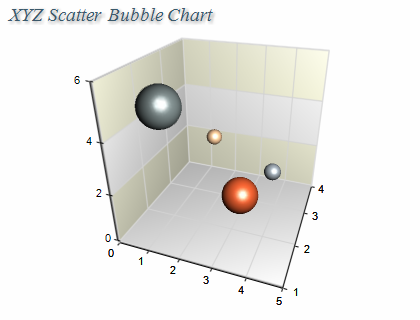
Bubble charts are a convenient way for graphical representation of multi-dimensional data. The data points are displayed as circles (or other shapes) with variable parameters (size, position etc.) that depend on the input data. The following image shows a typical bubble chart in 2D and 3D:
Creating a Bubble Series
Bubble series are represented by the NBubbleSeries type. An instance of this type must be added to the series collection of a Cartesian chart:
| C# |
Copy Code
|
|
NBubbleSeries bubble = new NBubbleSeries();
chart.Series.Add(bubble);
|
Passing Data
Bubble series accept data points of type NBubbleDataPoint. The following code snippet shows how to add data to a bubble series:
| C# |
Copy Code
|
|
NBubbleDataPoint bubbleDataPoint = new NBubbleDataPoint();
bubbleDataPoint.X = 10;
bubbleDataPoint.Value = 10;
bubbleDataPoint.Size = 10;
bubbleDataPoint.Fill = new NColorFill(NColor.Red);
bubble.DataPoints.Add(bubbleDataPoint);
|
Controlling the Bubble Sizes
You can specify the display sizes of the smallest and the largest bubbles through the MinSize and MaxSize properties. The following code shows how to set the min and max bubble sizes of a bubble series:
| C# |
Copy Code
|
|
bubble.MinSize = 10; // specified in dips
bubble.MaxSize = 50; // specified in dips
|
Controlling the Bubble Shape
The shape of the bubbles is controlled through the BubbleShape property. It accepts values from the ENPointShape3D enumeration. For example the following code will display the bubbles as spheres:
| C# |
Copy Code
|
|
bubble.Shape = ENPointShape3D.Sphere;
|
Formatting Commands
The bubble series supports the following formatting commands in addition to the standard (per data point) formatting commands:
<size> - displays the bubble size
See Also