Common Axis Functionality
In NOV Chart for .NET all axes (Cartesian and Polar) share a set of common features. This topic summarizes the common functionality found in those two types of axes.
Each axis in the chart has an associated scale that is accesible from the Scale property. Scales are discussed in detail in the topics dedicated to Scales. The following code snippet shows how to assign a different scale to a chart axis:
| C# |
Copy Code
|
|
chart.Axes[ENCartesianAxis.PrimaryX].Scale = new NDateTimeScale();
|
In order to determine the final axis view range the axis goes through the following process:
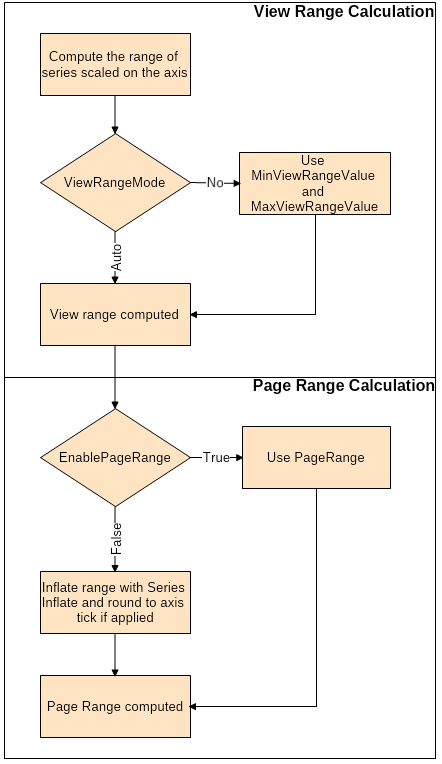
From this diagram it's clear that the axis final range is computed in two steps:
View Range Calculation
At this stage the axis determines the range of possibly visible values. By default the axis will use the range of the series scaled on it to compute the view range, however you can influence this process using the ViewRangeMode, MinViewRangeValue and MaxViewRangeValue properties. The following table summarizes this:
| ENAxisViewRangeMode |
Description |
| Auto |
The view range is computed based on the series range. |
| FixedMin |
The axis maximum range value is computed automatically and the minimum range value is taken from the MinViewRangeValue property. |
| FixedMax |
The axis minimum range value is computed automatically and the maximum range value is taken from the MaxViewRangeValue property. |
| FixedRange |
The minimum and maximum range values are taken from MinRangeValue and MaxRangeValue properties respectively. |
The following code shows how to fix the axis view range:
| C# |
Copy Code
|
|
axis.ViewRangeMode = ENAxisViewRangeMode.FixedRange;
axis.MinViewRangeValue = 0;
axis.MaxViewRangeValue = 10;
|
Page Range Calculation
At this stage the axis will compute the final range (page range). There are basically two options depending on the state of the EnablePageRange property. If it is set to true the computed View range is not regarded and instead is substituted with the value of the PageRange property. Otherwise the view range is inflated to accommodate the value of the previous min tick and next max tick on the scale as well as to accommodate the series inflate margins (if specified on a per series level). The following code shows how to turn off series inflate and scale round to tick:
| C# |
Copy Code
|
|
// Turn off series margin inflate
someSeries.InflateMargins = false;
// turn off scale inflate
NStandardScale scale = axis.Scale as NStandardScale;
scale.ViewRangeInflateMode = ENScaleViewRangeInflateMode.Logical;
scale.LogicalInflate = new NRange(0, 0);
|
When you use zooming and scrolling the control will automatically update the values of EnablePageRange and PageRange properties.
All axes have a property called
Anchor that controls how the axis is positioned on the chart. Take a look at the following topics showing how to modify the axis
Anchor property:
Cartesian Axes,
Polar Axes.