In This Topic
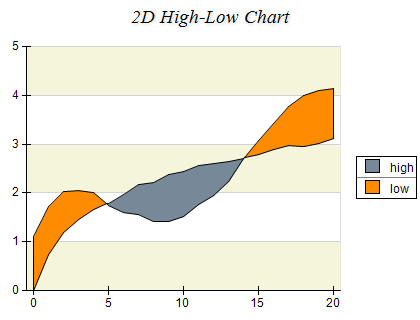
A High-Low Chart displays a sequence of data points, each representing a one-dimensional value range. The begin values of consecutive data points are connected with a "low" line. The end values are connected with a "high" line. The area between these two lines is filled with different colors, depending on whether the "high" line runs above or below the "low" line. The following image shows a standard high low chart:
Creating a High Low Series
High Low series are represented by the NHighLowSeries type. An instance of this type must be added to the series collection of a Cartesian chart:
| C# |
Copy Code
|
|
NHighLowSeries highLow = new NHighLowSeries();
chart.Series.Add(highLow);
|
Passing Data
High Low series accept data points of type NHighLowDataPoint. The following code snippet shows how to add several data points to a high low series:
| C# |
Copy Code
|
|
highLow.DataPoints.Add(new NHighLowDataPoint(10, 0));
highLow.DataPoints.Add(new NHighLowDataPoint(10, 10));
highLow.DataPoints.Add(new NHighLowDataPoint(0, 10));
|
Controlling the High Low Appearance
The high low series appearance is controlled from the AppearanceMode property accepting values from the ENHighLowAppearanceMode enum:
| ENHighLowAppearanceMode |
Description |
| Generic |
The filling and stroke of the high low segments are generic (taken from the data points). |
| HighLow |
The filling and stroke of the high low segments is taken from the HighFill, LowFill, HighStroke and LowStroke properties of the series. |
| Palette |
The filling is determined by the Palette property. |
The following code snippet shows how to configure the high low apperance in HighLow mode:
| C# |
Copy Code
|
highLow.AppearanceMode = ENHighLowAppearanceMode.HighLow;
highLow.HighFill = new NColorFill(NColor.Red);
highLow.LowFill = new NColorFill(NColor.Green);
highLow.HighStroke = new NStroke(NColor.DarkRed);
highLow.LowStroke = new NStroke(NColor.DarkGreen); |
If you intend to use the palette apperance mode you must provide a palette through the Palette property:
| C# |
Copy Code
|
highLow.ApperanceMode = ENHighLowAppearanceMode.Palette;
highLow.Palette = new NTwoColorPalette(NColor.Red, NColor.Green); |
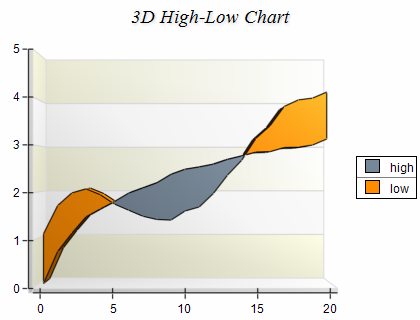
Depth Percent
In the case of 3D the depth of the high low series is specified in percents of the depth category it occupies. The DepthPercent property controls this percentage. By default it is set to 50 meaning that the high low series depth will be half the size of the Z category depth. The following code will make the high low depth bigger:
| C# |
Copy Code
|
| highLow.DepthPercent = 70; |
Formatting Commands
The high low series supports the following formatting commands in addition to the standard (per data point) formatting commands:
<high> - displays the data point high value.
<low> - displays the data point low value.
See Also