In This Topic
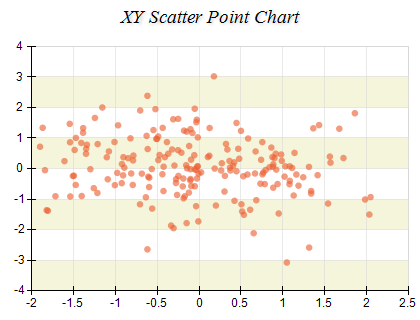
Point Charts display one or two dimensional data as points in a Cartesian coordinate system. Values are represented by the position of the points on the chart. The following image shows an xy scatter point chart:
Creating a Point Series
Point series are represented by the NPointSeries type. An instance of this type must be added to the series collection of a Cartesian chart:
| C# |
Copy Code
|
|
NPointSeries point = new NPointSeries();
chart.Series.Add(point);
|
Passing Data
Point series accept data points of type NPointDataPoint. The following code snippet shows how to add data to a point series:
| C# |
Copy Code
|
|
// enable x values
point.UseXValues = true;
// add data point
NPointDataPoint pointDataPoint = new NPointDataPoint();
pointDataPoint.Value = 10;
pointDataPoint.X = 10;
point.DataPoints.Add(pointDataPoint);
|
Controlling the Points Shape
The point series allows you to modify the point shape of all the data points in the series as well as individual data point. The following code snippet shows how to create a point series where all points use ellipse shape except the first one which uses rectangle:
| C# |
Copy Code
|
|
NPointSeries point = new NPointSeries();
chart.Series.Add(point);
// disable data labels
point.DataLabelStyle = new NDataLabelStyle(false);
// enable x values
point.UseXValues = true;
// change the default shape to ellipse
point.Shape = ENPointShape3D.Ellipse;
// add data point 1
NPointDataPoint dataPoint0 = new NPointDataPoint(0, 0);
dataPoint0.Shape = ENPointShape3D.Rectangle;
point.DataPoints.Add(dataPoint0);
// add data point 1
point.DataPoints.Add(new NPointDataPoint(10, 10));
// add data point 2
point.DataPoints.Add(new NPointDataPoint(20, 20));
|
Controlling the Points Size
The point size is controlled from the Size property of the NPointSeries. The following code modifies the size so that points are 10dips wide and tall:
| C# |
Copy Code
|
|
point.Size = 10;
|
See Also