In This Topic
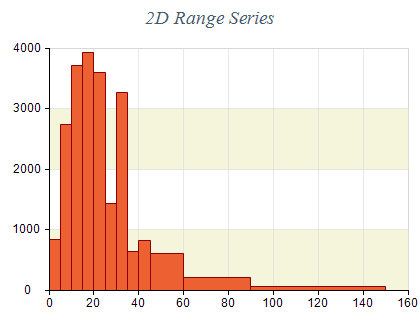
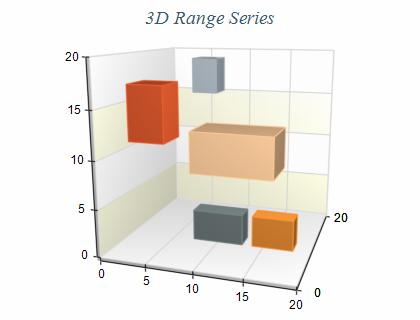
The Range Chart displays shapes defined by the begin / end values of their bounding boxes. It can be used for display of histograms, bars with custom sizes etc. The following image shows a range chart:
Creating a Range Series
Range series are represented by the NRangeSeries type. An instance of this type must be added to the series collection of a Cartesian chart:
| C# |
Copy Code
|
|
NRangeSeries range = new NRangeSeries();
chart.Series.Add(range);
|
Passing Data
Range series accept data points of type NRangeDataPoint. The following code snippet shows how to add data to a range series:
| C# |
Copy Code
|
|
// Enable X values
range.UseXValues = true;
// Add a range data point covering the range [0, 0] to [10, 10]
NRangeDataPoint rangeDataPoint = new NRangeDataPoint();
rangeDataPoint.X = 0;
rangeDataPoint.Value = 0;
rangeDataPoint.X2 = 10;
rangeDataPoint.Y2 = 10;
range.DataPoints.Add(rangeDataPoint);
|
Formatting Commands
The range series supports the following formatting commands in addition to the standard (per data point) formatting commands:
<y1> - displays the range y1 value. Has the same effect as the <value> command.
<x1> - displays the range x1 values. Has the same effect as the <xvalue> command.
<x2> - displays the range x2 value.
<y2> - displays the range y2 value.
<z1> - displays the range z1 value.
<z2> - displays the range z2 value.
See Also