In This Topic
Stock Charts display information about the movement of a stock price during a given interval (day, hour, minute etc.). NOV Chart supports both variations of the stock chart - candle and stick which differ only in the visual representation of the stock price movement.
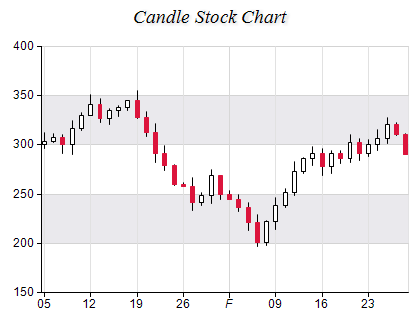
Candle Stock Charts display each data point as candle, where the candle body is formed by the open and close prices for the day. The high and low prices are displayed by vertical lines above and below the candle body. The body fill color depends on whether the stock price goes up (the closing price is higher than the opening price) or down (the closing price is lower than the opening price).
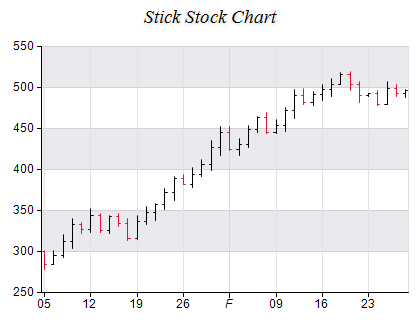
Stick Stock Charts do not draw a candle body. The open and close prices are marked by short horizontal lines, while the high-low range is presented as a single vertical line. The stroke style of a data point depends on whether the price goes up or down.
The following images show a candle stock and stick stock charts:
Creating a Stock Series
Stock series are represented by the NStockSeries type. An instance of this type must be added to the series collection of a Cartesian chart:
| C# |
Copy Code
|
|
NStockSeries stock = new NStockSeries();
chart.Series.Add(stock);
|
Passing Data
Range series accept data points of type NStockDataPoint. The following code snippet shows how to add data to a stock series:
| C# |
Copy Code
|
|
stock.UseXValues = true;
NStockDataPoint stockDataPoint = new NStockDataPoint();
stockDataPoint.X = NDateTime.ToOADate(someDateTime);
stockDataPoint.Open = 10;
stockDataPoint.Close = 12;
stockDataPoint.High = 15;
stockDataPoint.Low = 8;
stock.DataPoints.Add(stockDataPoint);
|
Controlling the Candle Shape
The NStockSeries CandleShape property controls whether the stock series displays a Candle or Stick Stock Chart. The following code snows how to modify this property:
| C# |
Copy Code
|
|
stock.CandleShape = ENCandleShape.Rectangle; // use candle stock chart
stock.CandleShape = ENCandleShape.Stick; // use stick stock chart
|
Controlling the Candles and Stick Appearance
A candle is considered with up orientation if its open value is smaller than its close value. Otherwise it is considered with down orientation. Up candles are displayed with the styles specified in the UpFill and UpStroke properties. Down candles are displayed with the styles specified in the DownFill and DownStroke properties. The following code will display the up candles in blue and the down candles in green:
| C# |
Copy Code
|
|
stock.UpFill = new NColorFill(NColor.Blue);
stock.UpStroke = new NStroke(1, NColor.DarkBlue);
stock.DownFill = new NColorFill(NColor.Green);
stock.DownStroke = new NStroke(1, NColor.DarkGreen);
|
Controlling the Visibility of Stick Stock Open and Close Values
The open and close values are displayed as ticks on the line connecting the high and low values. You can control their visibility with the help of the ShowOpen and ShowClose properties, which are set to true by default. The following code will display a High - Low - Close chart.
| C# |
Copy Code
|
stock.ShowOpen = false;
stock.ShowClose = true;
|
Formatting Commands
The stock series supports the following formatting commands in addition to the standard (per data point) formatting commands:
<high> - displays the data point high value.
<low> - displays the data point low value.
<open> - displays the data point open value.
<close> - displays the data point close value.
See Also