DateTime Scale
In This Topic
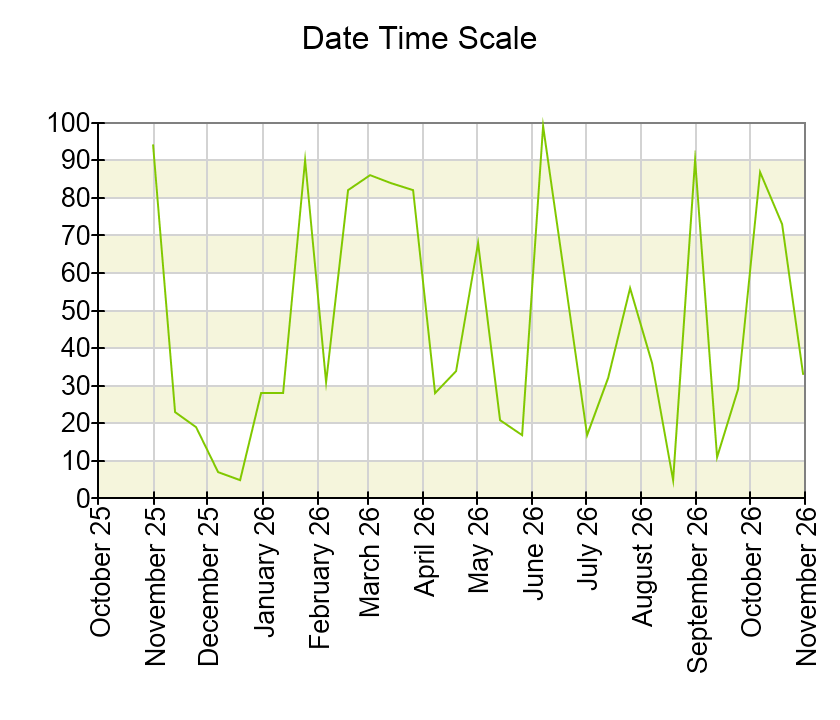
The date time scale is a type of scale that annotates a range of time using a step comprising one of the common date time units (second, minute, hour, day, week, month etc) and a multiplier. It is commonly to plot data sets that tracks a measurement over time - for example temperature over a span of one year. The following picture shows a date time scale, that decorates a span of one year using a step of one month and Month name/Year formatting:
Creating a DateTime Scale
You create a date time scale by creating an instance of the NDateTimeScale class. The following code shows how to create a Date/Time scale and assign it to the primary X axis of a Cartesian chart:
| C# |
Copy Code
|
|
NCartesianChart chart = (NCartesianChart)chartView.Surface.Charts[0];
NDateTimeScale dateTimeScale = new NDateTimeScale();
chart.Axes[ENCartesianAxis.PrimaryX].Scale = dateTimeScale;
|
Controlling the Date Time Units
The date time scale generates ticks according to the MajorTickMode property. You can limit the selection of DateTime units that can be chosen as the basis for the tick/label step when the scale uses an automatic step (AutoMinDistance, AutoMaxCount) by setting the AutoDateTimeUnits property of the scale. The following code shows how to limit the selection of units to just hour, day and month:
| C# |
Copy Code
|
| dateTimeScale.AutoDateTimeUnits = new NDomArray<NDateTimeUnit>(new NDateTimeUnit[] { NDateTimeUnit.Hour, NDateTimeUnit.Day, NDateTimeUnit.Month }); |
Working Calendar
The date time scale also supports the work calendar feature. For more information check out the Work Calendar topic.