Line Study Series
In This Topic
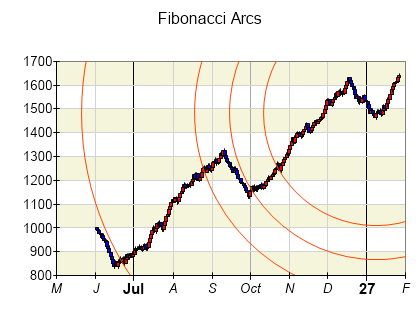
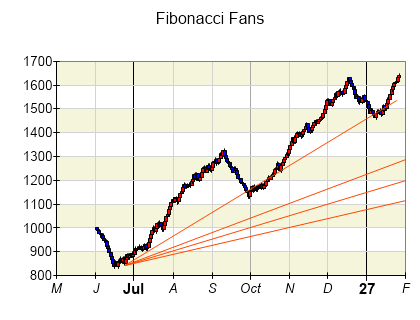
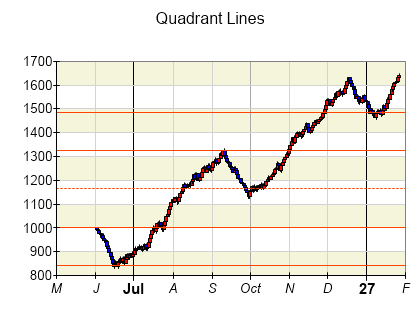
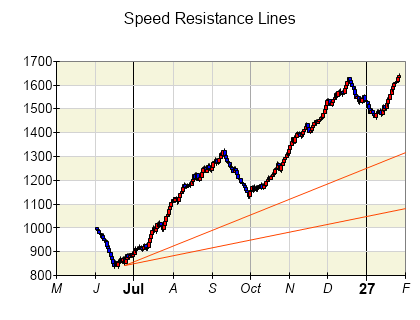
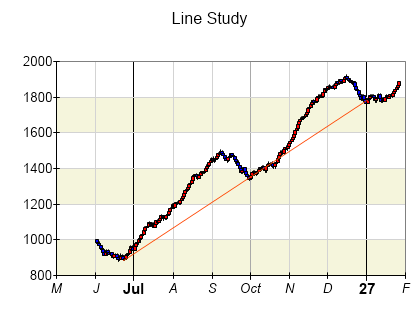
The Line Study series displays lines or circles a function that aim to study the market behavior and monitor price trends, channels, support and resistance levels, as well as to try to predict the possible future market movement.
The following image shows the a line study:
Creating a Line Study Series
Trendline series are represented by the NLineStudySeries type. An instance of this type must be added to the series collection of a Cartesian chart:
| C# |
Copy Code
|
NLineStudySeries lineStudy = new NLineStudySeries();
chart.Series.Add(lineStudy);
|
Passing Data
The line study is defined by its Begin and End points. The following code shows how to create a line study based on two points:
| C# |
Copy Code
|
NLineStudySeries lineStudy = new NLineStudySeries();
lineStudy.BeginPoint = new NPoint(0, 0);
lineStudy.BeginPoint = new NPoint(1, 1);
|
Line Study Type
Retracement Values
By default the control will use automatic retracement values dependent on the LineStudyType for line study types that use them, but you can also provide custom retracement values using the RetracementValues property of the series:
| C# |
Copy Code
|
lineStudySeries.RetracementValues = new NDomArray<double>(new double[] { 0.382, 0.5, 0.618 } );
|
Formatting Commands
The trendline series supports the following formatting commands in addition to the standard (per data point) formatting commands:
<beginX>, <beginY> - represents the Begin property X and Y values respectively.
<endX, endY>- represents the End property X and Y values respectively.
See Also