Scale Breaks
In This Topic
xScale breaks allow you to skip a range of data along an axis, thereby increasing the visual space available for the data outside that range. This feature is most commonly used in the following cases:
- When you need to display data that varies greatly in magnitude.
- When you want to reduce the effect of several large values (peaks) on the scaling of the remaining data.
- When you want to skip unimportant data in order to focus on the rest.
Nevron Chart provides complete support for scale breaks on all types of axes (horizontal, vertical, depth, reversed, date-time, etc.) in both 2D and 3D modes. It allows full control over the position and style of each scale break.
Each axis scale can contain an unlimited number of scale breaks, which are created by adding instances of NScaleBreak derived classes, as shown in the following table:
| Class |
Description |
| NAutoScaleBreak |
Represents one or more scale breaks dynamically introduced to the scale if data displayed on it varies in magnitude above a specified threshold value. |
| NCustomScaleBreak |
Represents a custom defined scale break that will effectively skip the specified range of the data from the scale. |
Automatic Scale Breaks
Automatic scale breaks appear on the scale only if the data displayed on the axis contains outliers. For example consider the following charts:
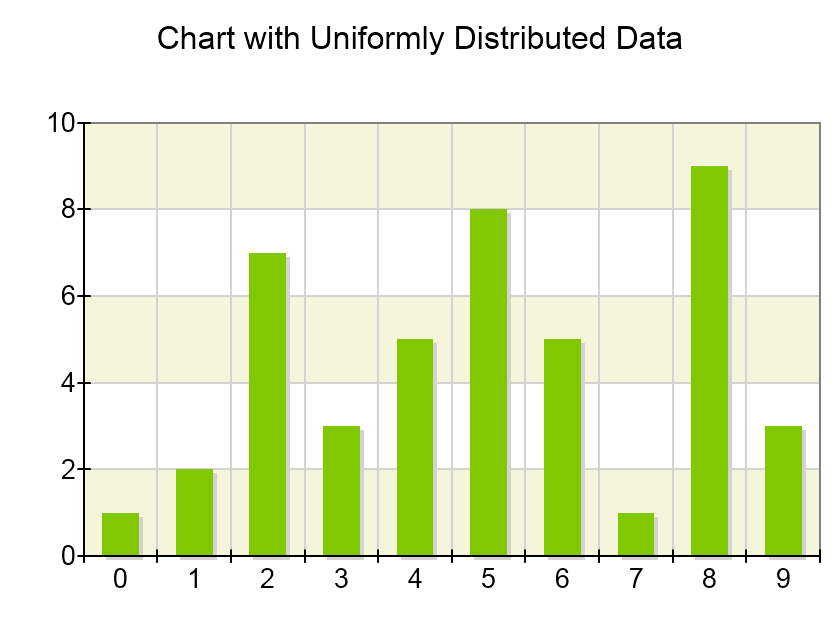
1.Chart with data that is regularly distributed over the scale range
2. Chart with data containing outliers:
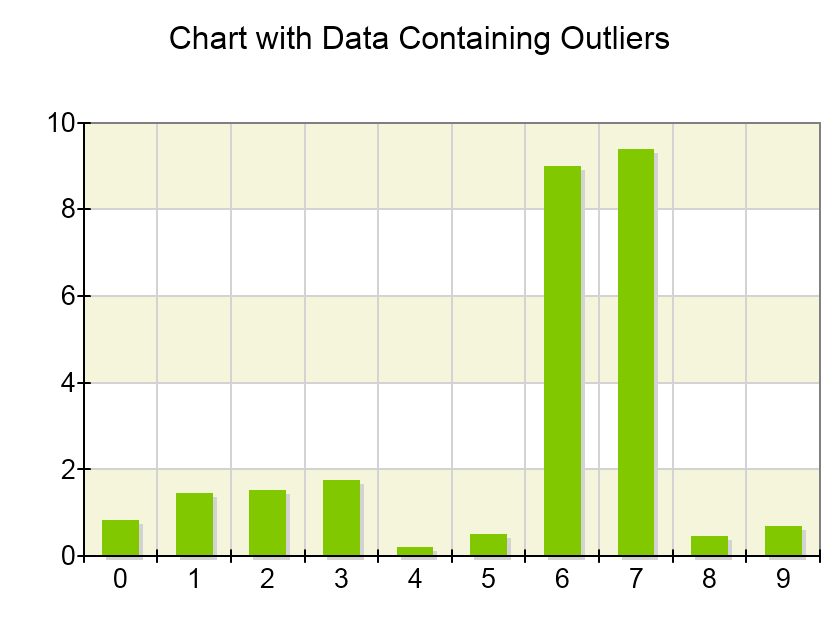
The presence of outliers in the data expands the axis range (in this case, the Y-axis range), which reduces the visibility for the rest of the data that, which while uniformly distributed and containing more data points, has smaller variations in the range. As a result, the chart becomes harder to read because differences within the smaller range are no longer visually distinguishable.
To solve this problem you may want to introduce an automatic scale break that will appear when the data contains peaks. In order to do so you need to create an object of type NAutoScaleBreak and add it to the ScaleBreaks collection property of the scale associated with the axis. The following code snippet shows how to achieve this:
| C# |
Copy Code
|
NCartesianChart chart = (NCartesianChart)chartView.Surface.Charts[0];
NCartesianAxis axis = chart.Axes[ENCartesianAxis.PrimaryY];
axis.Scale.ScaleBreaks.Add(new NAutoScaleBreak());
|
This will produce the following chart:
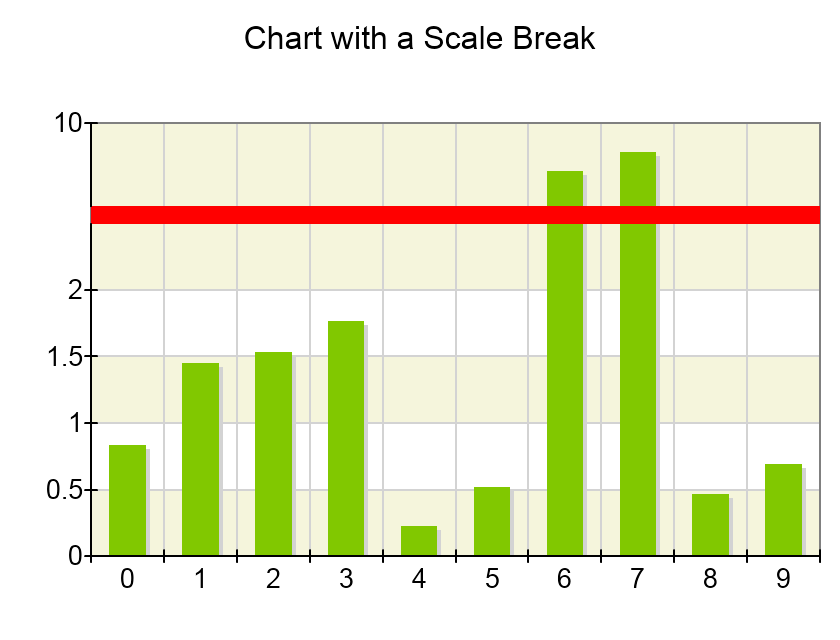
Note that now it’s much easier to distinguish the differences in the data contained in the range [0, 2], because the chart has allocated more visual space to it at the expense of the data in the range [2,10].
Threshold Factor
The ThresholdFactor property of the NAutoScaleBreak class controls when scale breaks appear. The threshold is calculated as follows:
threshold = DataGapRangeLength / DataRangeLength
In the case of the above chart the gap in data occurs from [2, 9] (there is no data in that range) and the data range is [0.2, 9.5] (all data is contained in this range). Therefore the threshold is:
7 / 9.3 = 0.75
By default value of the threshold factor is 0.4 and this is why the scale break will appear given the above data set. To following code shows how to change the value of this property:
| C# |
Copy Code
|
NCartesianChart chart = (NCartesianChart)chartView.Surface.Charts[0];
NCartesianAxis axis = chart.Axes[ENCartesianAxis.PrimaryY];
NAutoScaleBreak autoScaleBreak = new NAutoScaleBreak();
autoScaleBreak.ThresholdFactor = 0.5f;
axis.Scale.ScaleBreaks.Add(autoScaleBreak);
|
Auto Scale Break Count
When the threshold value is small you may have several gaps in data that satisfy the specified threshold. In this case the automatic scale break will create scale breaks starting from the biggest gap until the number of scale breaks reaches the MaxScaleBreakCount property of the NAutoScaleBreak class or there are no more gaps that satisfy the threshold factor. For example consider the following chart:
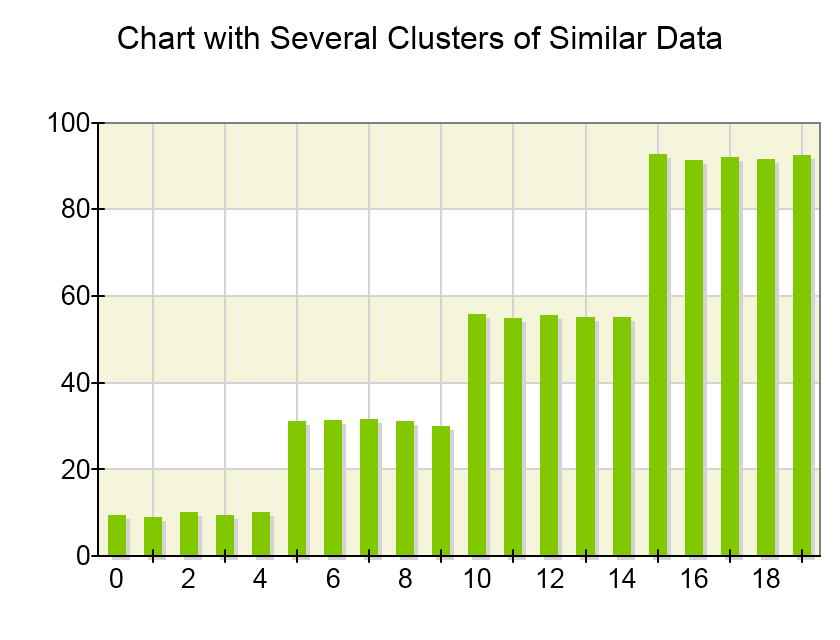
This chart contains several clusters or data that has little variations. In such cases having automatic scale breaks enables the user to better spot the variations of data within those clusters:
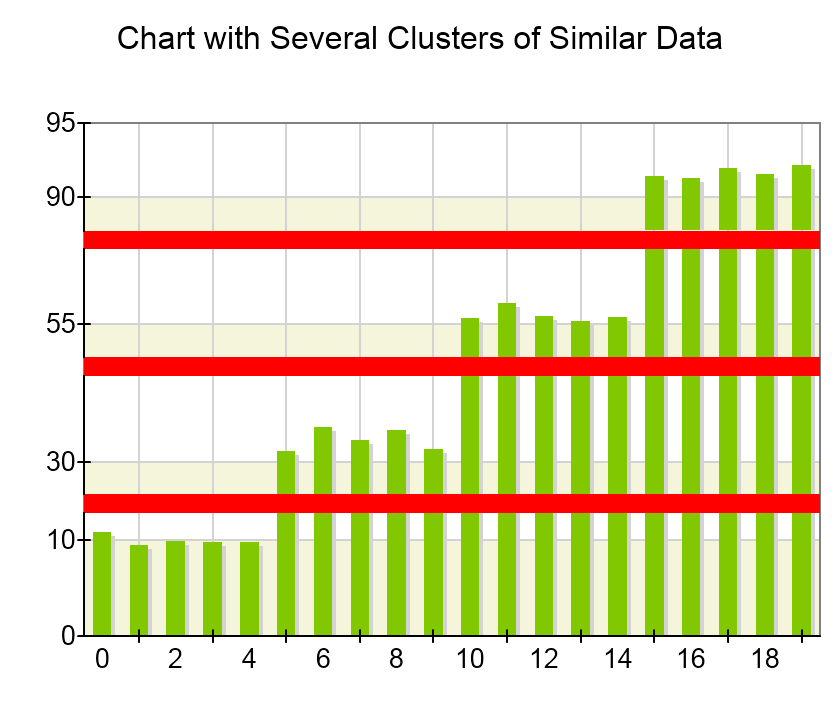
To MaxScaleBreakCount property of the NAutoScaleBreak class controls how many breaks can be introduced to the chart.
Custom Scale Breaks
Custom scale breaks allow you to add a scale break at a fixed range on the scale. They are represented by an instance of the NCustomScaleBreak class. The following code shows how to add a scale break that spans the range [15, 25]:
| C# |
Copy Code
|
NCartesianChart chart = (NCartesianChart)chartView.Surface.Charts[0];
NCartesianAxis axis = chart.Axes[ENCartesianAxis.PrimaryY];
NCustomScaleBreak customScaleBreak = new NCustomScaleBreak(new NRange(15, 25));
axis.Scale.ScaleBreaks.Add(customScaleBreak);
|
| Chart with Several Clusters of Similar Data |
Represents one or more scale breaks dynamically introduced to the scale if data displayed on it varies in magnitude above a specified threshold value. |
| NCustomScaleBreak |
Represents a custom defined scale break that will effectively skip the specified range of the data from the scale. |
Scale Break Position
The scale break object (custom or automatic) has a property called PositionMode that accepts values from the ENScaleBreakPositionMode enumeration. This property controls the location of the scale break on the scale. The following table shows the possible options for this property:
| ENScaleBreakPositionMode |
Description |
| Percent |
The scale break position is determined in percentages relative to the scale segment it splits. |
| Range |
The scale break position is determined relative to the range of the scale break on the scale. |
| Content |
The scale break position is determined according to the amount of data left on the sides of the scale break. |
| C# |
Copy Code
|
NCartesianChart chart = (NCartesianChart)chartView.Surface.Charts[0];
NCartesianAxis axis = chart.Axes[ENCartesianAxis.PrimaryY];
NCustomScaleBreak customScaleBreak = new NCustomScaleBreak();
customScaleBreak.PositionMode = ENScaleBreakPositionMode.Percent;
customScaleBreak.PercentRange = new NRange(15, 25);
axis.Scale.ScaleBreaks.Add(customScaleBreak);
|
Scale Break Inflate
When using scale breaks it is often useful to have some means to instruct the control to slightly inflate the ranges that fall on the left and right sides of the break. This is useful when you want to avoid having data that lies too close to the scale break. For example consider the following image:
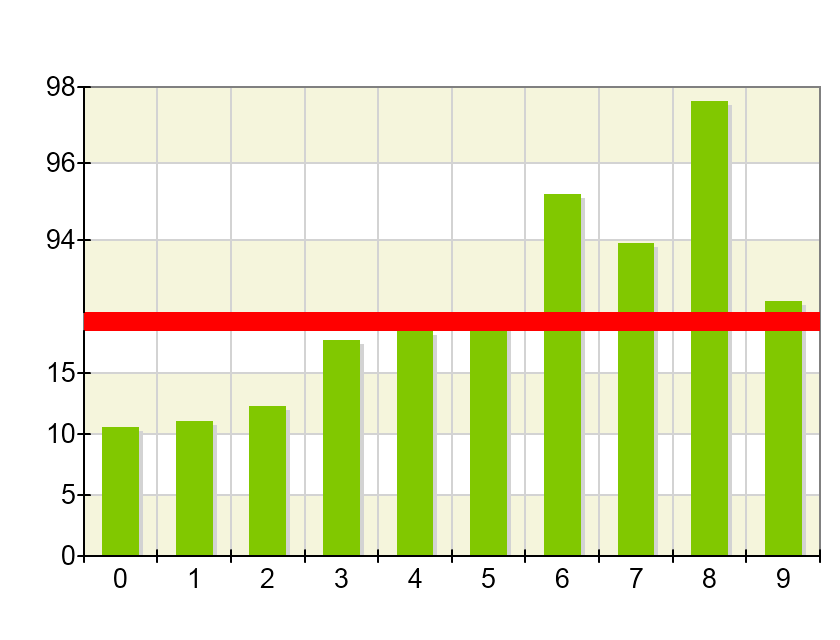
This image shows an automatic scale break that does not have any range inflate. As a result the values above 15 and over 90 are very close the scale break which reduces the chart readability. To overcome this you may consider to inflate the scale break as shown on the following picture:
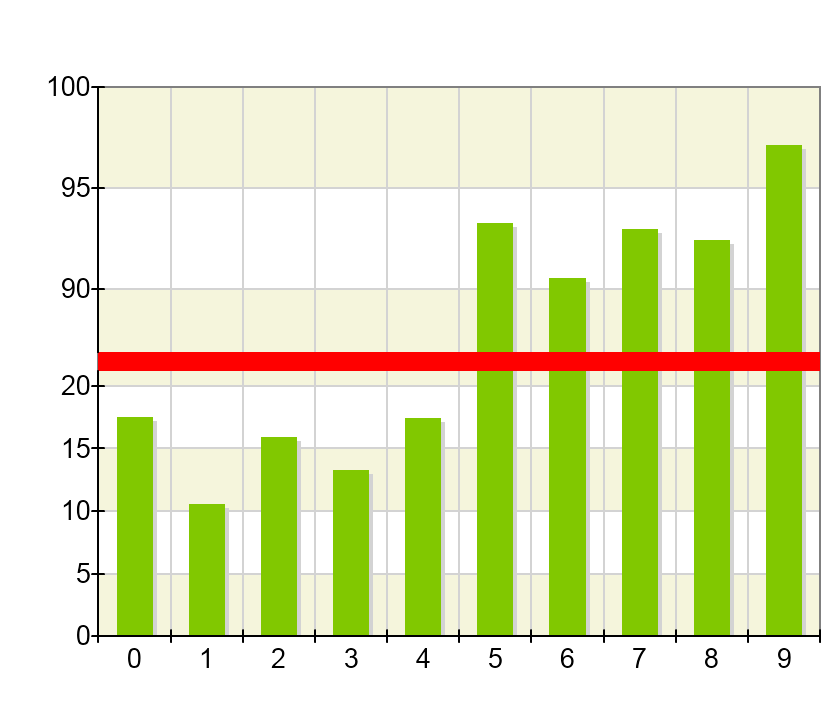
Here the content ranges on the left and right sides of the break are inflated so that content does not appear close to scale break. The scale break inflate is controlled with the help of the InflateMode property:
| ENScaleBreakInflateMode |
Description |
| Absolute |
Inflates the left and right content ranges of the scale break in logical units by using the values specified from the LeftInflate and RightInflate properties of the scale break |
| Relative |
Inflates the left and right content ranges of the scale break in logical units, relative to their respective length in logical units. The percentages are controlled from the LeftInflatePercent and RightInflatePercent properties. |
The following code snippet shows how to control the scale break inflate:
| C# |
Copy Code
|
NAutoScaleBreak scaleBreak = new NAutoScaleBreak();
scaleBreak.InflateMode = ENScaleBreakInflateMode.Relative;
scaleBreak.LeftInflatePercent = 5;
scaleBreak.RightInflatePercent = 5;
axis.Scale.ScaleBreaks.Add(scaleBreak);
|
Scale Break Appearance
The scale break has several properties that control its apperaance. The filling and stroke of the scale break are controlled from the Fill and Stroke properties. The following code for example modifies the fill and stroke of:
| C# |
Copy Code
|
scaleBreak.Fill = new NColorFill(NColor.Blue);
scaleBreak.Stroke = new NStroke(1, NColor.DarkBlue);
|
You can also modify the scale break shape using the Style property, which accepts values from the ENScaleBreakStyle enumeration:
| ENScaleBreakStyle |
Description |
| Line |
The scale break appears as a two lines at the begin and end values of the scale break. |
| Wave |
The scale break is represented with a wave. The pattern of the wave is controlled from the Pattern property. The horizontal and vertical steps of the wave are controlled from the HorizontalStep and VerticalStep properties respectively. |
| ZigZag |
This pattern resembles a wave, but it is represented using straight lines instead of curves. |