Surface Series Overview
In This Topic
NOV Chart for .NET offers support for several types of surface series designed to visualize data as a 3D surface. These series depict a set of points in a three-dimensional space by connecting them with a triangular network, creating a continuous surface. The surface series in the control have common functionality for controlling the surface fill and frame appearance but differ in the way the surface data is organized. This topic discusses some of the common features shared by the different surface series in the control.
In NOV Chart the different surface series are represented by the NGridSurfaceSeries, NMeshSurfaceSeries, NTriangulatedSurfaceSeries, and NVertexSurfaceSeries types, which derive from the NSurfaceSeriesBase class, that implements the common surface functionality.
Surface Fill
The surface series filling visibility is controlled from the ShowFill property. When set to true the type of filling displayed by the series is controlled by the combination of FillColorMode, Fill and Palette properties. The Fill property controls the transparency and material properties of the surface, and optionally the filling in case the FillColorMode is set to Uniform. Below is a table enumerating the options of the options of ENColorMode enum accepted by the FillColorMode property:
| ENSurfaceFillMode |
Description |
| Uniform |
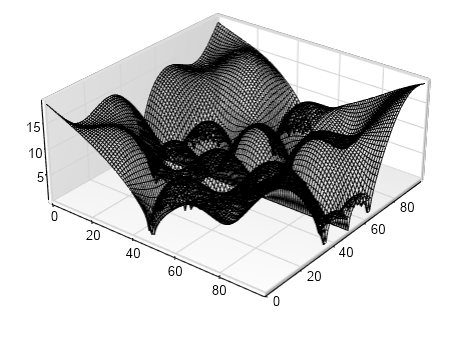
The surface is filled with a uniform fill style, specified through the Fill property of the surface series. The following picture shows a surface with uniform filling:
|
| Zone |
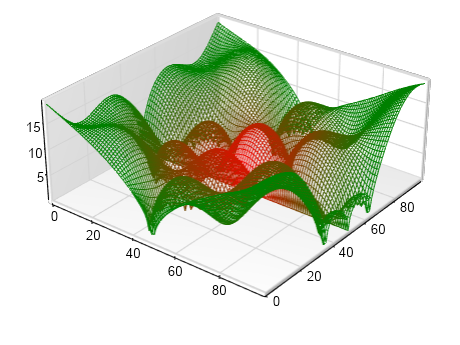
The surface fill is divided into elevation zones based on the Palette object associated with the surface series. The images below illustrate a surface using a zoned palette fill with discrete and smooth palette modes:
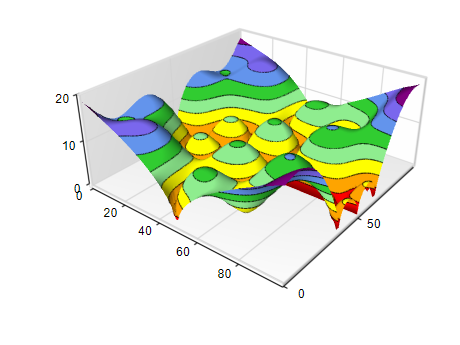 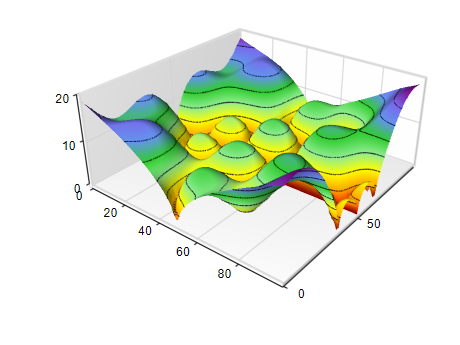
|
| CustomColors |
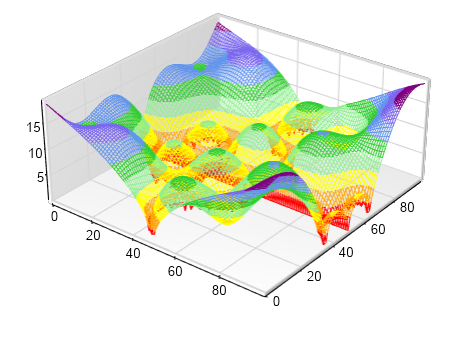
The surface fill is defined by the colors assigned to each data point in the surface’s data object color channel. The image below shows a surface rendered with per–data point coloring:
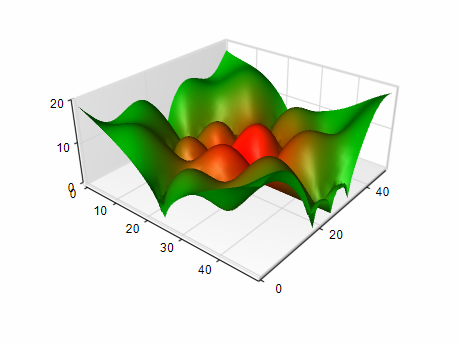
|
The following code snippet shows how to modify the FillColorMode property to achieve different filling types:
| C# |
Copy Code
|
// surface filling with white to black palette
surface.FillColorMode = ENColorMode.Zone;
surface.Palette = new NTwoColorPalette(NColor.White, NColor.Black);
// uniform surface filling
surface.FillColorMode = ENColorMode.Uniform;
surface.Fill = new NColorFill(NColor.Blue);
// surface filling with custom colors.
surface.FillColorMode = ENColorMode.Custom;
surface.Data.HasColors = true;
|
In the case of custom per data point colors you need to provide color information for each vertex in the surface Data object.
Surface Frame
The surface frame visibility is controlled by the ShowFrame property. When set to true, the frame appearance is determined by a combination of the FrameMode and FrameColorMode properties. The first property defines how the frame is constructed, while the second determines its color. The following table lists the available options for the FrameMode property:
| ENSurfaceFrameMode |
Description |
| Mesh |
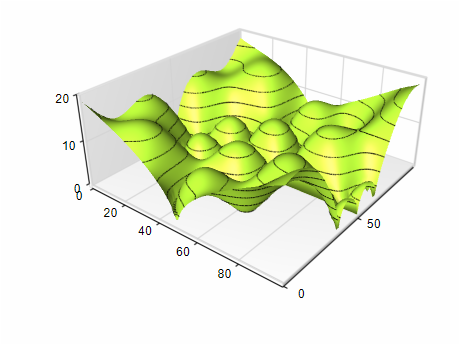
The surface displays lines that connect adjacent data points. This frame type allows you to visualize the triangular network that connects the data points of the surface. The following picture shows a surface with a Mesh frame:
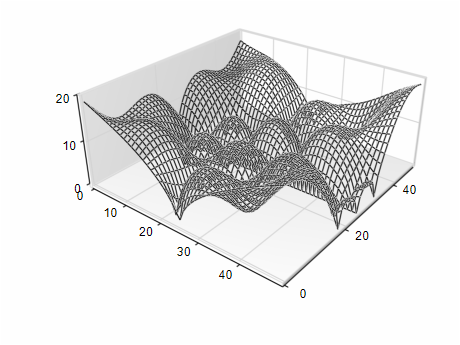 |
| Contour |
The surface displays contour lines at the elevations specified by the Palette object attached to the surface. The following picture shows a surface with a Contour frame:
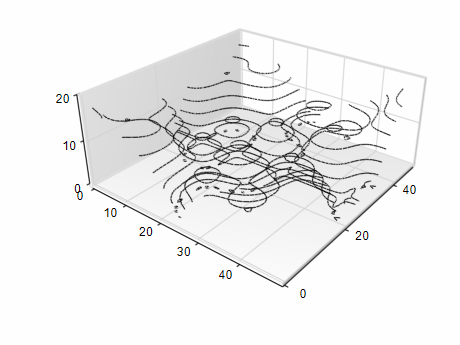 |
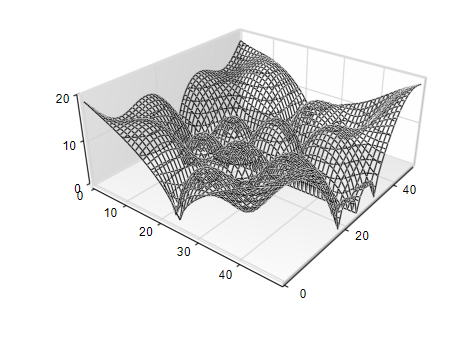
| MeshContour |
The surface displays both mesh and contour lines. The following picture shows a surface with mesh and contour lines:
 |
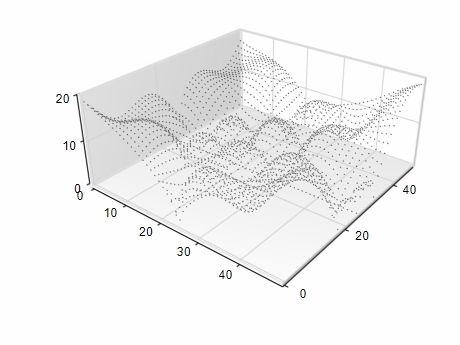
| Dots |
The surface displays dots at the positions of each data point in the surface. The following picture shows a surface that displays dots at the data point's positions:
 |
The code snippet below shows how to modify the FrameMode property:
| C# |
Copy Code
|
surface.FrameMode = ENSurfaceFrameMode.Contour;
|
The surface frame lines or dots (depending on the current FrameMode) are colored depending on the value of the FrameColorMode property that accepts values from the ENColorMode enumeration. The following table lists the available options:
| ENSurfaceFrameColorMode |
Description |
| Zone |
The surface frame lines are colored depending on the color specified for their elevation by the Palette object attached to the series:
|
| Uniform |
The surface frame has a uniform stroke style, that is controlled from the Stroke property of the series:
|
| Custom |
The surface frame lines or dots have a custom color from the color channel of the Data object attached to the surface series.
|
| C# |
Copy Code
|
// applies palette colors to the surface frame
surface.FrameColorMode = ENSurfaceFrameColorMode.Zone;
|
Shading Mode
Surface series support flat and smooth shading modes that affect the surface appearance when lighting effects are turned on. When using smooth shading (also known as Gouraud shading), the surface calculates the color intensity at each vertex of the triangular mesh and then interpolates these colors across the triangle's surface. In contrast, flat shading assigns a single color to each triangle face, which results in a more faceted appearance. The shading mode is controlled by the ShadingMode property that accepts values from the ENShadingMode enumeration. By default, the shading mode is set to ENShadingMode.Flat, because it is less computationally expensive and results in faster surface series rendering.
The following code shows how to modify the ShadingMode property:
| C# |
Copy Code
|
surface.ShadingMode = ENShadingMode.Smooth;
|
Surface Palette
The surface series has an attached palette object that defines the colors for the surface filling (when SurfaceFillStyle.Zone is used) as well as the colors for the surface frame (when the FrameColorMode property is set to ENSurfaceFrameColorMode.Zone). This object is accessible from the surface series Palette property. The following code shows how to create a palette with 4 zones:
| C# |
Copy Code
|
surface.Palette = new NNFixedMulticolorPalette(new NColor[] {
                NColor.Red,
                NColor.Orange,
                NColor.Yellow,
                NColor.LightGreen });
|
Flat Contour Chart
The surface series can be displayed at a fixed elevation (flat contour surface chart). This is enabled by setting the DrawFlat property of the series to true. When this mode is enabled the vertical position of the surface is controlled from the FlatPositionMode and FlatPosition properties. The former accepts values from the ENSurfaceFlatPositionMode enumeration:
| ENSurfaceFlatPositionMode |
Description |
| AxisBegin |
The flat surface is positioned at the vertical axis begin value. |
| AxisEnd |
The flat surface is positioned at the vertical axis end value. |
| CustomValue |
The user specifies the position of the surface through the FlatPositionValue property. |
Custom Contour Lines
In addition to the automatically generated contour lines when the FrameMode is set to ENSurfaceFrameMode.Contour the surface series can also display contour lines at custom specified elevation, and with controllable stroke. This is achieved by adding objects of type NContourLine to the ContourLines collection of the series. The following code shows how to create a custom contour line and specify its value and stroke:
| C# |
Copy Code
|
NContourLine contourLine = new NContourLine();
contourLine.Value = 100;
contourLine.Stroke = new NStroke(2.0f, NColor.Red);
surface.ContourLines.Add(contourLine);
|
Shader (GPU only) Rendering
The surface series by default will use a combination of CPU / GPU rendering, where some of the calculations are performed by the CPU and others are done on the GPU. The advantage of this approach is that computations that can be executed only once are done on the CPU and all the rest is performed on the GPU. In some cases, however, for example, when you have large dynamically changing data set in real time it is better to perform all calculations on the GPU. To enable this feature you need to set the EnableShaderRendering property to true:
| C# |
Copy Code
|
surface.EnableShaderRendering = true;
|
Surface Cell Triangulation
A mesh and grid surface series represent data as a grid where each cell is defined by four neighboring data points which form a rectangle. To visualize the surface each grid cell is split into two adjacent triangles. This can be done in two alternative ways, depending on which pairs of opposing points in the cell are connected with a diagonal. The selection of a diagonal is called cell triangulation. The mesh and grid surface series support several modes for cell triangulation, and the currently used one is specified with the CellTriangulationMode property accepting values from the ENSurfaceCellTriangulationMode enumeration.
The default mode is ENSurfaceCellTriangulationMode.MaxSum, which means that the points with the maximum sum of the elevations are connected with a diagonal. The triangulation mode can be controlled through the CellTriangulationMode property. It accepts values from the ENSurfaceCellTriangulationMode enumeration:
| ENSurfaceCellTriangulationMode |
Description |
| Diagonal1 |
The cell is triangulated by its first diagonal. |
| Diagonal2 |
The cell is triangulated by its second diagonal. |
| MaxSum |
The cell is split by the diagonal, which has the larger sum of its end point's values. This is the default. |
| MinSum |
The cell is split by the diagonal, which has the smaller sum of its end point's values. |
The following code sets how to set the CellTriangulationMode property:
| C# |
Copy Code
|
gridSurface.CellTriangulationMode = ENSurfaceCellTriangulationMode.MinSum;
|
Legend Mode
The surface series can dispay the palette used to render the surface filling in tabular or color map format on the legend. To instruct the series to display this information on the legend, you need to set the LegendMode property of the series to SeriesLogic. In this case you can further control how to display the palette information using the PaletteLegendMode property. The following options are available:
| ENPaletteLegendMode |
Description |
| Table |
In this mode the legend displays a table showing the begin/end zone value and color for each zone in the currently displayed palette. To control the formatting of the begin / end zone values you need to modify the legend formatting (see the Legend Formatting section in this topic). |
| ColorMap |
In this mode the legend displays color map information iun the form of a scale and gradient color map. |
| C# |
Copy Code
|
gridSurface.CellTriangulationMode = ENSurfaceCellTriangulationMode.MinSum;
|
Multithreading
The surface series supports multithreaded contour extraction, as well as triangulation in the case of the Triangulated series. Multithreading is enabled by default and is controlled by the EnableThreadedContourGeneration and EnableThreadedTriangulation properties. The following code sample shows how to disable multithreading for a Triangulated surface::
| C# |
Copy Code
|
triangulatedSurface.EnableThreadedTriangulation = false;; triangulatedSurface.EnableThreadedContourGeneratation = false;;
|
Legend Formatting
The surface series supports the following formatting commands for the legend item texts:
<zone_value> - palette value (for smooth palette only)
<zone_begin> - begin value of a zone (the lower value)
<zone_end> - second value of a zone (the higher value)
The following formatting commands are supported for the tooltip texts:
<value> - elevation value of a data point
<index> - index of a surface segment
<xindex> - x index of a surface segment
<zindex> - z index of a surface segment
The formatting properties for all elevation values can be controlled through the ValueFormatter property.
See Also