Timespan scale
In This Topic
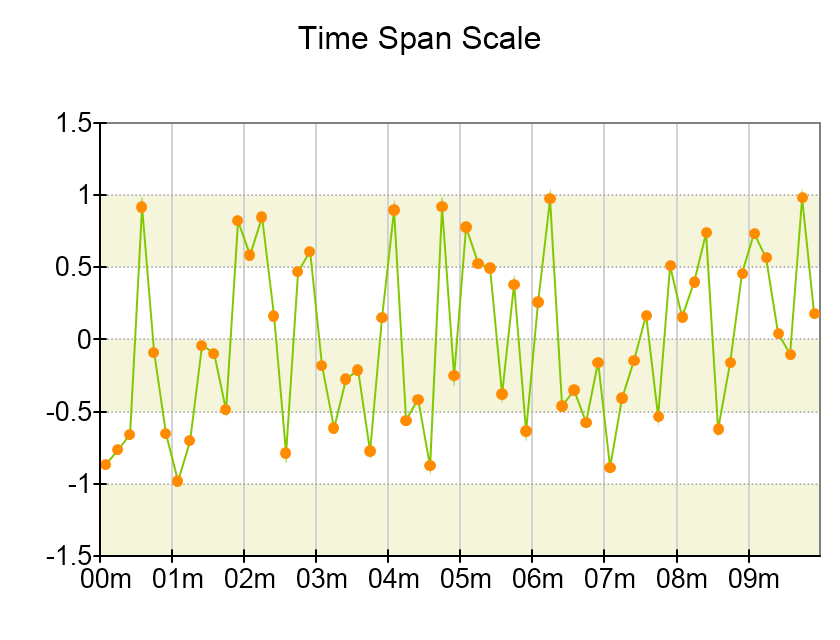
The time span scale is used when you need to display time duration which is not necessarily linked to specific date or when the date information is not relevant to the data being plotted. The timespan scale is similar to the date/time scale with the exception that it only uses time units when generating the scale ticks (time units include the Tick, Millisecond, Second, Minute, Hour, Half Day, Day, and Week units). The following image shows a time span scale:
Creating a TimeSpan Scale
You create a date time scale by creating an instance of the NDateTimeScale class. The following code shows how to create a Date/Time scale and assign it to the primary X axis of a Cartesian chart:
| C# |
Copy Code
|
|
NCartesianChart chart = (NCartesianChart)chartView.Surface.Charts[0];
NDateTimeScale dateTimeScale = new NDateTimeScale();
chart.Axes[ENCartesianAxis.PrimaryX].Scale = dateTimeScale;
|
Controlling the Date Time Units
The date time scale generates ticks according to the MajorTickMode property. You can limit the selection of DateTime units that can be chosen as the basis for the tick/label step when the scale uses an automatic step (AutoMinDistance, AutoMaxCount) by setting the AutoDateTimeUnits property of the scale. The following code shows how to limit the selection of units to just hour, day and month:
| C# |
Copy Code
|
| dateTimeScale.AutoDateTimeUnits = new NDomArray<NDateTimeUnit>(new NDateTimeUnit[] { NDateTimeUnit.Hour, NDateTimeUnit.Day, NDateTimeUnit.Month }); |