To customize the text of the labels, use the TextProvider property of the scale's Labels child. This is typically used with ordinal scales:
| Customize the text of the labels |
Copy Code
|
|---|---|
string[] labelTexts = new string[] { "Label 1", "Label 2", "Label 3" }; NOrdinalScale scale = (NOrdinalScale)chart.Axes[ENCartesianAxis.PrimaryX].Scale; scale.Labels.TextProvider = new NOrdinalScaleLabelTextProvider(labelTexts); |
|
The following is a complete example that creates a bar chart showing the programming languages popularity:
| Complete example - bar chart with custom texts on the X axis |
Copy Code
|
|---|---|
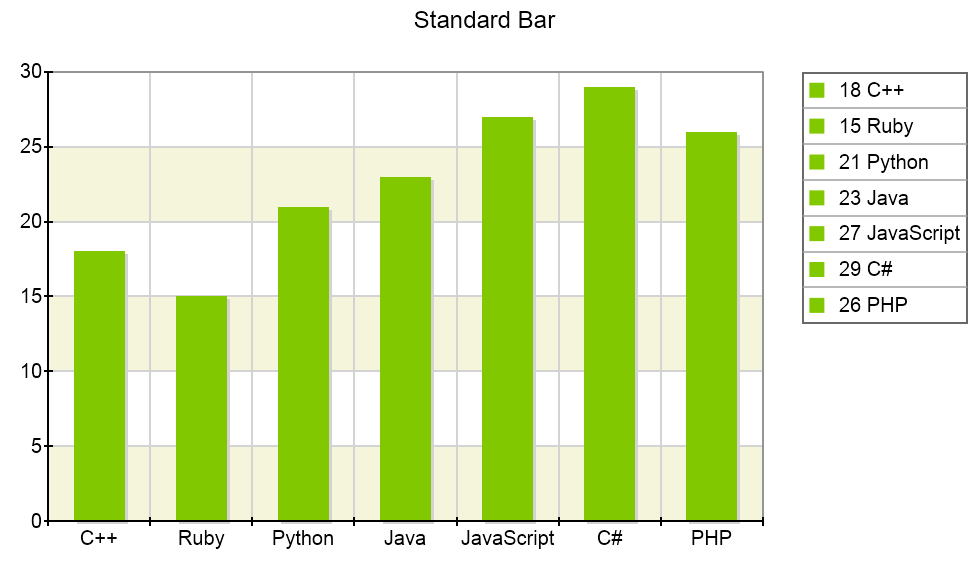
NChartViewSurface chartSurface = chartView.Content; chartSurface.CreatePredefinedChart(ENPredefinedChartType.Cartesian); // Set the title chartSurface.Titles[0].Text = "Standard Bar"; // Configure the chart NCartesianChart chart = (NCartesianChart)chartSurface.Charts[0]; chart.SetPredefinedCartesianAxes(ENPredefinedCartesianAxis.XOrdinalYLinear); // Add an interlace stripe NLinearScale linearScale = chart.Axes[ENCartesianAxis.PrimaryY].Scale as NLinearScale; NScaleStrip strip = new NScaleStrip(new NColorFill(ENNamedColor.Beige), null, true, 0, 0, 1, 1); strip.Interlaced = true; linearScale.Strips.Add(strip); // Setup a bar series NBarSeries bar = new NBarSeries(); bar.Name = "Bar Series"; bar.InflateMargins = true; bar.UseXValues = false; bar.Shadow = new NShadow(NColor.LightGray, 2, 2); // Add some data to the bar series bar.LegendView.Mode = ENSeriesLegendMode.DataPoints; bar.DataPoints.Add(new NBarDataPoint(18, "C++")); bar.DataPoints.Add(new NBarDataPoint(15, "Ruby")); bar.DataPoints.Add(new NBarDataPoint(21, "Python")); bar.DataPoints.Add(new NBarDataPoint(23, "Java")); bar.DataPoints.Add(new NBarDataPoint(27, "JavaScript")); bar.DataPoints.Add(new NBarDataPoint(29, "C#")); bar.DataPoints.Add(new NBarDataPoint(26, "PHP")); chart.Series.Add(bar); // Configure the X axis to show the language names string[] labels = new string[bar.DataPoints.Count]; for (int i = 0; i < bar.DataPoints.Count; i++) { labels[i] = bar.DataPoints[i].Label; } NOrdinalScale xAxisScale = (NOrdinalScale)chart.Axes[ENCartesianAxis.PrimaryX].Scale; xAxisScale.Labels.TextProvider = new NOrdinalScaleLabelTextProvider(labels); |
|
The code above creates the following chart:

For more information on stripes see the Scale Strip Lines topic.
