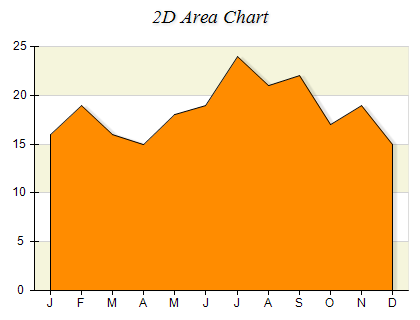
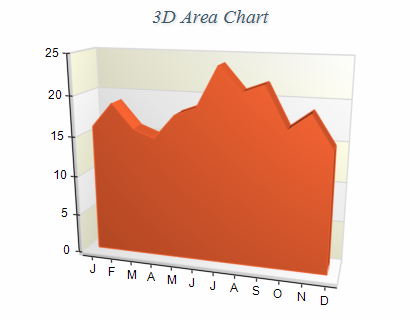
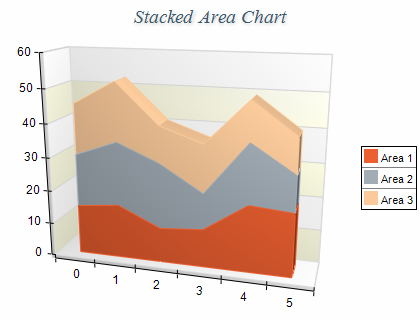
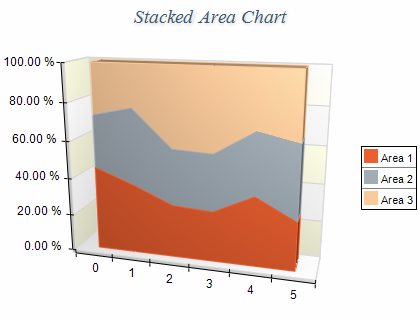
Area charts depict a change of some value, usually over time. They are similar to Line charts, but emphasize the trend by filling the area between the axis and the line formed by the area values. The following image shows a typical area and stacked area charts in 2D and 3D:


Area series are represented by the NAreaSeries type. An instance of this type must be added to the series collection of a Cartesian chart:
| C# |
Copy Code
|
NAreaSeries area = new NAreaSeries();
chart.Series.Add(area);
|
Area series accept data points of type NAreaDataPoint. The following code snippet shows how to add several data points to an area series:
| C# |
Copy Code
|
area.DataPoints.Add(new NAreaDataPoint(10));
area.DataPoints.Add(new NAreaDataPoint(20));
area.DataPoints.Add(new NAreaDataPoint(30));
|
Controlling the area origin
By default, the area uses zero as the origin value (the area fills the span from zero to the area value). You can modify this behavior by setting the OriginMode property. The following table lists the available options:
| ENSeriesOriginMode |
Description |
| CustomOrigin |
The series origin value is specified by the Origin property. |
| MinValue |
The series min value is used as a series origin. |
| MaxValue |
The series max value is used as a series origin. |
| ScaleMin |
The min scale value is used as a series origin. |
| ScaleMax |
The max scale value is used as a series origin. |
The following code snippet changes the area origin value to 10:
| C# |
Copy Code
|
area.OriginMode = ENSeriesOriginMode.CustomOrigin;
area.CustomOrigin = 10;
|
In the case of 3D the depth of the area is specified in percents of the depth category occupied by the area series. This is controlled by the DepthPercent property. By default, it is set to 50 meaning that the area depth will be half the size of the respective depth category. The following code makes the area depth bigger:
| C# |
Copy Code
|
area.DepthPercent = 70;
|
Creating a Stacked Area Chart
A Stacked Area chart displays related data groups, as areas that are stacked on top of each other. It is used to show how each group contributes to the total as well as the trends of the total, usually over time. The series are displayed as sequences of straight line segments and the area between each two line is filled. The value of the uppermost line depends on the total value sum for each category. To create a stacked area chart you need to add several NAreaSeries objects to the chart series collection and then set the MultiAreaMode property of the first area series to ENMultiAreaMode.Series. Then you need to set the MultiAreaMode property of the subsequent area series to ENMultiAreaMode.Stacked or ENMultiAreaMode.StackedPercent to produce a stacked or stacked percent area chart. The following example demonstrates how to create a stacked area chart that contains two area series:
| C# |
Copy Code
|
// create two area series
NAreaSeries area1 = new NAreaSeries();
chart.Series.Add(area1);
NAreaSeries area2 = new NAreaSeries();
chart.Series.Add(area2);
// stack the second area over the first one
area1.MultiAreaMode = ENMultiAreaMode.Series;
area2.MultiAreaMode = ENMultiAreaMode.Stacked;
|
When an area series is stacked it is always displayed with origin 0.
Stacked percent area charts do not support negative values. All values are internally converted to their absolute values.
The area series can have an associated palette, in which case the Fill properties of the series / data points is discarded. The following code snippet shows how to apply a palette filling:
| C# |
Copy Code
|
area.Palette = new NTwoColorPalette(NColor.Red, NColor.Green);
|
The area series supports the following formatting commands in addition to the standard (per data point) formatting commands:
<total> - displays the absolute sum of the values in the current stack.
<cumulative> - displays the sum of the values up to the current stack value.
<percent> - displays the percent contribution of the value to the total pile sum.


