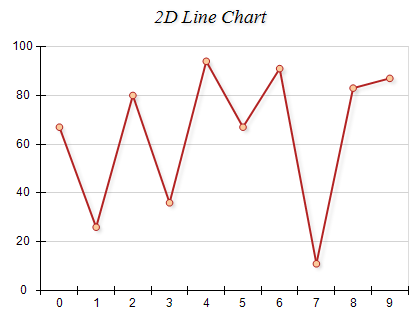
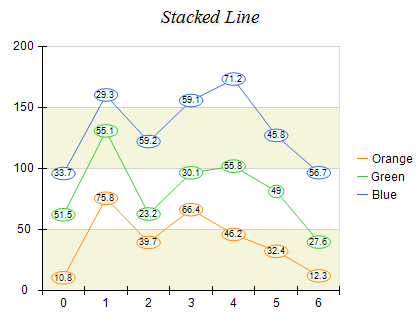
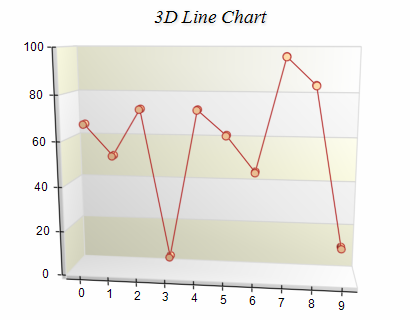
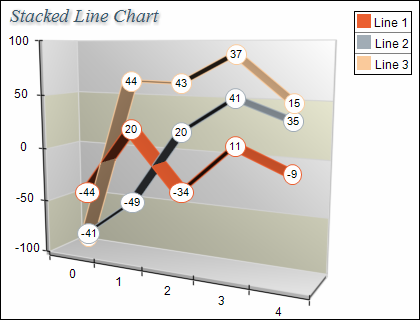
A Line Chart displays a sequence of data points connected by a line. Each pair of consecutive points is connected with straight-line segments. The following images show standard and stacked line charts in 2D and 3D:
Line series are represented by the NLineSeries type. An instance of this type must be added to the series collection of a Cartesian chart:
| C# |
Copy Code
|
NLineSeries line = new NLineSeries();
chart.Series.Add(line);
|
Line series accept data points of type NLineDataPoint. The following code snippet shows how to add data to a line series:
| C# |
Copy Code
|
line.UseXValues = true;
NLineDataPoint lineDataPoint1 = new NLineDataPoint();
lineDataPoint1.Value = 0;
lineDataPoint1.X = 0;
line.DataPoints.Add(lineDataPoint1);
NLineDataPoint lineDataPoint2 = new NLineDataPoint();
lineDataPoint2.Value = 1;
lineDataPoint2.X = 1;
line.DataPoints.Add(lineDataPoint2);
|
The above code creates a line series connecting the coordinate [0, 0] to [1, 1].
Creating the Stacked Line Chart
A Stacked Line chart displays related data groups, one on top of the other. It is used to show how each group contributes to the total as well as the trends of the total, usually over time. The individual line series are displayed as sequences of straight line segments. Each line series is stacked on top of the previous one. To display stacked line charts you need to add several NLineSeries objects to the chart series collection. The MultiLineMode property of the first line series must be set to ENMultiLineMode.Series. The MultiLineMode property of subsequent line series in the stack group must be set to ENMultiLineMode.Stacked. The following example demonstrates how to create a stack line chart with two line series:
| C# |
Copy Code
|
NLineSeries line1 = new NLineSeries();
chart.Series.Add(line1);
NLineSeries line2 = new NLineSeries();
chart.Series.Add(line2);
line1.MultiLineMode = ENMultiLineMode.Series;
line2.MultiLineMode = ENMultiLineMode.Stacked;
|
Creating a Stacked Percent Line Chart
Stacked Percent Line charts represent the relative contribution of the data series to the total for each category. The series is displayed as sequences of straight line segments. Each line series is stacked on top of the previous one. The height of the uppermost line is always the full height of the chart and represents 100% of the total for each category. The Y scale range is always from 0 to 1. Similarly to Stacked Line Charts, Stacked Percent Line charts are created by adding several NLineSeries to the chart series collection. The MultiLineMode property of the first line series must be set to ENMultiLineMode.Series. The MultiLineMode property of the subsequent line series in the stack group must be set to ENMultiLineMode.StackedPercent. The following example demonstrates how to create a stacked percent line chart with three stacks:
| C# |
Copy Code
|
NLineSeries line1 = new NLineSeries();
chart.Series.Add(line1);
NLineSeries line2 = new NLineSeries();
chart.Series.Add(line2);
NLineSeries line3 = new NLineSeries();
chart.Series.Add(line3);
line1.MultiLineMode = ENMultiLineMode.Series;
line2.MultiLineMode = ENMultiLineMode.StackedPercent;
line3.MultiLineMode = ENMultiLineMode.StackedPercent;
|
When a line series is displayed in stacked percent mode the min value of the series is always 0 and the max value of the series is always 1. Since it is common to display the user the [0, 1] range in percentages [0%-100%] you often need to apply a different value formatter to the labels:
| C# |
Copy Code
|
NLinearScale linearScale = chart.Axes[ENCartesianAxis.PrimaryY].Scale as NLinearScale;
linearScale.Labels.TextProvider = new NFormattedScaleLabelTextProvider(new NNumericValueFormatter(ENNumericValueFormat.Percentage));
|
Stacked percent line charts do not support negative values. All values are internally converted to their absolute value.
The line series supports the following formatting commands in addition to the standard (per data point) formatting commands:
<total> - displays the absolute sum of the values in the current stack.
<cumulative> - displays the sum of the values up to the current stack value.
<percent> - displays the percent contribution of the value to the total pile sum.