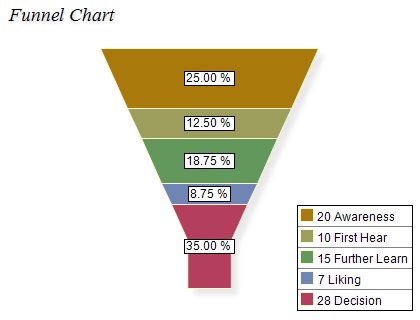
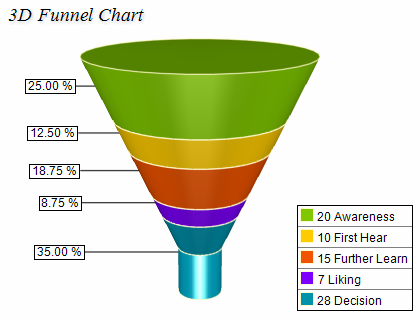
In order to show data in the funnel series you need to add an instance on the NFunnelSeries class to the funnel chart series collection. The following image shows a 2D and 3D funnel chart:


Only the first funnel series in the collection is regarded.
The following code snippet creates a new funnel series with sample data and adds it to a funnel chart:
| C# |
Copy Code
|
NFunnelSeries funnelSeries = new NFunnelSeries();
funnelChart.Series.Add(funnelSeries);
funnelSeries.DataPoints.Add(new NFunnelDataPoint(20.0, "Awareness"));
funnelSeries.DataPoints.Add(new NFunnelDataPoint(10.0, "First Hear"));
funnelSeries.DataPoints.Add(new NFunnelDataPoint(15.0, "Further Learn"));
funnelSeries.DataPoints.Add(new NFunnelDataPoint(7.0, "Liking"));
funnelSeries.DataPoints.Add(new NFunnelDataPoint(28.0, "Decision"));
|
This will create a standard funnel chart. You can control the funnel neck width and height using the
NeckWidthPercent and
NeckHeightPercent properties.
Creating a Scatter Funnel Series
In some cases, you may want to have a funnel where each slice has a different user specified width. In such cases you need to pass an additional x value to the funnel data point and set the UseXValues property of the NFunnelSeries object to true:
| C# |
Copy Code
|
NFunnelSeries funnelSeries = new NFunnelSeries();
funnelChart.Series.Add(funnelSeries);
funnelSeries.UseXValues = true;
funnelSeries.Shape = ENFunnelShape.Rectangle;
funnelSeries.DataPoints.Add(new NFunnelDataPoint(20.0, 20.0, "Awareness"));
funnelSeries.DataPoints.Add(new NFunnelDataPoint(10.0, 10.0, "First Hear"));
funnelSeries.DataPoints.Add(new NFunnelDataPoint(15.0, 15.0, "Further Learn"));
funnelSeries.DataPoints.Add(new NFunnelDataPoint(7.0, 7.0, "Liking"));
funnelSeries.DataPoints.Add(new NFunnelDataPoint(28.0, 28.0, "Decision"));
|
Controlling the Funnel Shape
The funnel series has a property called Shape which allows you to modify the shape of individual funnel slices. Possible values for this property are ENFunnelShape.Rectangle and ENFunnelShape.Trapezoid. The following code snippet modifies the funnel shape to rectangle:
| C# |
Copy Code
|
funnelSeries.Shape = ENFunnelShape.Rectangle;
|
Controlling the Funnel Label Mode
Each funnel data point can display an associated data label. The position of the data label depends on the value of the funnel series LabelMode property. The following table lists the available options:
| ENFunnelLabelMode |
Description |
| Left |
Funnel labels are aligned to the left funnel rim. If labels are overlapping the rules described in the Series Label Layout topic apply. |
| Center |
Funnel labels are placed at the center. If labels are overlapping the rules described in the Series Label Layout topic apply. |
| Right |
Funnel labels are placed at the right funnel rim. If labels are overlapping the rules described in the Series Label Layout topic apply. |
| LeftAligned |
Funnel labels are placed at the left side. Label overlapping is resolved in the same way as pie spider labels. |
| RightAligned |
Funnel labels are placed at the right side. Label overlapping is resolved in the same way as pie spider labels. |
When the funnel labels mode is set to LeftAligned or RightAligned you can control the distance of the labels from the leftmost or rightmost funnel side using the LabelArrowLength property of the funnel series object.


