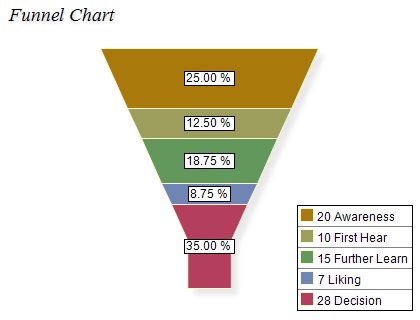
You create a funnel chart by creating an instance of the NFunnelChart class. There are two ways to achieve this - using a predefined chart type or configuring it through code. The following code snippets show how each of those approaches works:
Creating a Funnel Chart Using a Predefined Chart Type
| C# |
Copy Code
|
|---|---|
chartView.Surface.CreatePredefinedChart(ENPredefinedChartType.Funnel);
// obtain an instance ot the funnel chart
NFunnelChart funnelChart = (NFunnelChart)chartView.Surface.Charts[0];
|
|
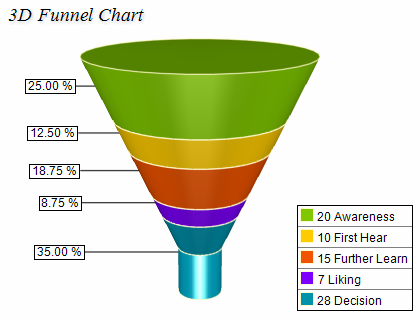
Creating a Funnel Chart from Code
| C# |
Copy Code
|
|---|---|
// create a dock panel NDockPanel dockPanel = new NDockPanel(); chartView.Surface.Content = dockPanel; // create a docked label NLabel label = new NLabel(); label.Text = "Funnel Chart"; NDockLayout.SetDockArea(label, ENDockArea.Top); dockPanel.AddChild(label); // create a new legend NLegend legend = new NLegend(); NDockLayout.SetDockArea(legend, ENDockArea.Right); dockPanel.AddChild(legend); // create a new funnel chart NFunnelChart funnelChart = new NFunnelChart(); NDockLayout.SetDockArea(funnelChart, ENDockArea.Center); dockPanel.AddChild(funnelChart); |
|