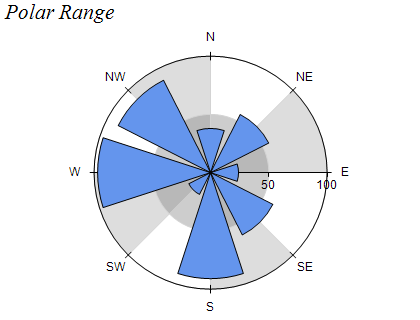
The Polar Range Chart also known as Polar Rose Chart displays shapes defined by the begin / end polar coordinates of their bounding boxes. The following image shows a polar range chart:
Polar Range series are represented by the NPolarRangeSeries type. An instance of this type must be added to the series collection of a Polar chart:
| C# |
Copy Code
|
NPolarRangeSeries polarRange = new NPolarRangeSeries();
polarChart.Series.Add(polarRange);
|
Polar Range series accept data points of type NPolarRangeDataPoint. The following code snippet shows how to add data to a polar range series:
| C# |
Copy Code
|
NPolarRangeDataPoint polarRangeDataPoint = new NPolarRangeDataPoint();
polarRangeDataPoint.X = 0;
polarRangeDataPoint.Y = 0;
polarRangeDataPoint.X2 = 90;
polarRangeDataPoint.Y = 10;
polarRange.DataPoints.Add(polarRangeDataPoint);
|
The range series supports the following formatting commands in addition to the standard (per data point) formatting commands:
<y1> - displays the range y1 value. Has the same effect as the <value> command.
<x1> - displays the range x1 values. Has the same effect as the <xvalue> command.
<x2> - displays the range x2 value.
<y2> - displays the range y2 value.