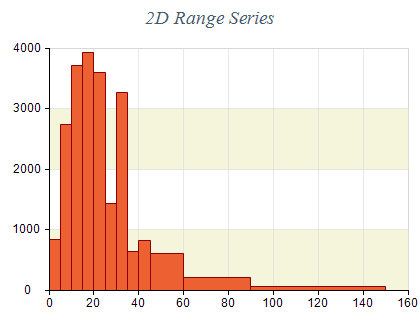
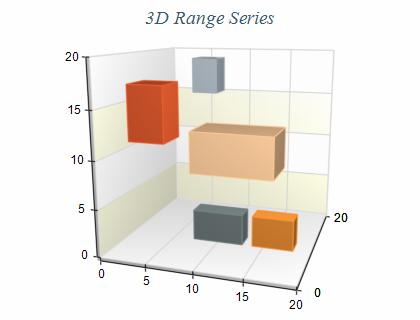
The Range Chart displays shapes defined by the begin and end values of their bounding boxes. It can be used for the display of histograms, bars with custom sizes, etc. The following image shows a range chart:
Range series are represented by the NRangeSeries type. An instance of this type must be added to the series collection of a Cartesian chart:
| C# |
Copy Code
|
NRangeSeries range = new NRangeSeries();
chart.Series.Add(range);
|
Range series accept data points of type NRangeDataPoint. The following code snippet shows how to add data to a range series:
| C# |
Copy Code
|
// Enable X values
range.UseXValues = true;
// Add a range data point covering the range [0, 0] to [10, 10]
NRangeDataPoint rangeDataPoint = new NRangeDataPoint();
rangeDataPoint.X = 0;
rangeDataPoint.Value = 0;
rangeDataPoint.X2 = 10;
rangeDataPoint.Y2 = 10;
range.DataPoints.Add(rangeDataPoint);
|
The range series supports the following formatting commands in addition to the standard (per data point) formatting commands:
<y1> - displays the range y1 value. Has the same effect as the <value> command.
<x1> - displays the range x1 values. Has the same effect as the <xvalue> command.
<x2> - displays the range x2 value.
<y2> - displays the range y2 value.
<z1> - displays the range z1 value.
<z2> - displays the range z2 value.