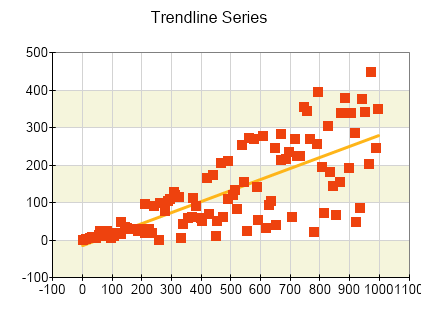
The Trendline series displays a function that approximates or fits the data from a specified source series.

Creating a Trendline Series
Trendline series are represented by the NTrendlineSeries type. An instance of this type must be added to the series collection of a Cartesian chart:
| C# |
Copy Code
|
NTrendlineSeries range = new NTrendlineSeries();
chart.Series.Add(range);
|
The Trendline series accepts data from another XY or XYZ Cartesian series. This series is called source series and must be present in the Series collection of the same chart that the trendline series belongs to. The following code snippet shows how to configure a trendline series:
| C# |
Copy Code
|
// add dummy data to the source series
NPointSeries sourceSeries = new NPointSeries();
sourceSeries.DataPoints.Add(10.0);
sourceSeries.DataPoints.Add(14.0);
sourceSeries.DataPoints.Add(9.0);
chart.Series.Add(sourceSeries);
// create a trendline that displays a logarithmic fit
NTrendlineSeries trendlineSeries = new NTrendlineSeries();
trendlineSeries.TrendlineType = ENTrendlineType.Logarithmic;
trendlineSeries.SourceSeries = sourceSeries;
chart.Series.Add(trendlineSeries);
|
The trendline series supports several approximation methods, and the currently used one is controller from the TrendlineType property of the series that accepts values from the ENTrendlineType enumeration:
| ENTrendlineType |
Description |
| Linear |
Represents linear fitting (also known as linear regression). This is a type of approximation where the trendline fits the incoming data set to a linear function, that will represent it with a minimal error. The linear function is represented by the following equation:
y = a + b.x
|
| Logarithmic |
Represents logarithmic fitting (also known as logarithmic regression). This is a type of approximation where the trendline fits the incoming data set to a logarithmic function, that will represent it with a minimal error. The logarithmic function is represented by the following equation:
y = a + b.ln(x)
|
| Exponential |
Represents exponential fitting. This is a type of approximation where the trendline fits the incoming data set is appximated to an exponential function, that will represent it with a minimal error. The exponential function is represented by the following equation:
y = a.ebx
|
| Power |
Represents power fitting (also known as power-law regression). This is a type of approximation where the trendline fits the incoming data set to a power-law function, that will represent it with a minimal error. The power function is represented by the following equation:
y = a.xn
|
| Polynomial |
Represents polynomial fitting, which is a type of approximation, where the trendline fits the incoming data set to a polynomial equation of a specified order (controlled by the by the PolynomialOrder property). The polynomial equations is represented by the following equation:
y = anxn+an−1xn−1+…+a1x+a0
where "n" is the degree of the polynomial specified by the PolynomialOrder property.
|
| MovingAverage |
The moving average fitting approximates the incoming data set by taking the arithmetic mean of a specified number of values that precede the value being fitted. This number of values is commonly called value window or period and is controlled by the MovingAveragePeriod property of the trendline series.
|
The trendline series supports the following formatting commands in addition to the standard (per data point) formatting commands:
<a> - represents the a parameter in case the trendline type is Linear, Logarithmic, Exponential, or Power.
<b>- represents the b parameter in case the trendline type is Linear, Logarithmic, Exponential, or Power.

