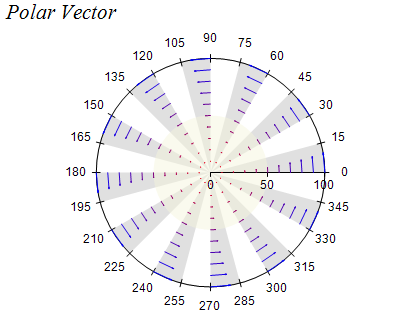
Polar Vector charts display vectors defined by two points (begin and end) which are represented as an arrow in polar coordinate space. An arrowhead is placed at the end point to indicate the vector direction. The following image shows a polar vector chart:
Creating a Polar Vector Series
Polar Vector series are represented by the NPolarVectorSeries type. An instance of this type must be added to the series collection of a Polar chart:
| C# |
Copy Code
|
NPolarVectorSeries polarVector = new NPolarVectorSeries();
polarChart.Series.Add(polarVector);
|
Polar Range series accept data points of type NPolarVectorDataPoint. The following code snippet shows how to add data to a polar vector series:
| C# |
Copy Code
|
NPolarVectorDataPoint polarVectorDataPoint = new NPolarVectorDataPoint();
polarVectorDataPoint.X = 0;
polarVectorDataPoint.Y = 0;
polarVectorDataPoint.X2 = 90;
polarVectorDataPoint.Y2 = 10;
polarVector.DataPoints.Add(polarVectorDataPoint);
|
Controlling the Vector Arrowhead Size
The width and height of the vector arrowhead are relative to the vector length, so shorter vectors have smaller arrowheads and longer vectors have larger arrowheads. The sizes are controlled through the ArrowheadSizeFactor properties. The MinArrowHeadSize and MaxArrowHeadSize properties can be used to set the minimum and maximum sizes of the arrowhead.
The vector series supports the following formatting commands in addition to the standard (per data point) formatting commands:
<y1> - displays the vector y1 value. Has the same effect as the <value> command.
<x1> - displays the vector x1 values. Has the same effect as the <xvalue> command.
<x2> - displays the vector x2 value.
<y2> - displays the vector y2 value.