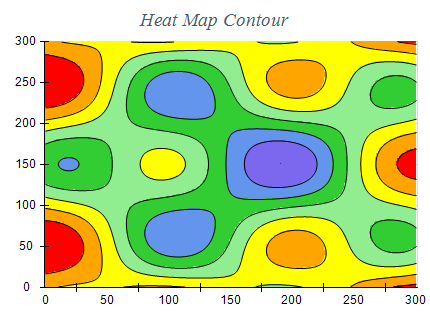
A heat map chart is a 2D representation of data where the individual values are contained in a matrix. Each value in the matrix is displayed with a color from a palette object associated with the chart. Optionally the heat map can also show contour levels. The following image shows a heat map with contours:
Creating a Heat Map Series
Heat Map series are represented by the NHeatMapSeries type. An instance of this type must be added to the series collection of a Cartesian chart:
| C# |
Copy Code
|
NHeatMapSeries heatMap = new NHeatMapSeries();
chart.Series.Add(heatMap);
|
The heat map series has an associated object of type NGridData which is accessible from the Data property of the series. This object represents a two dimensional matrix of double values. Before setting values in the matrix you must first initialize the grid data dimensions by using the Size property. The following code snippet shows how to create a simple 2x2 matrix:
| C# |
Copy Code
|
NGridData data = heatMap.Data;
data.Size = new NSizeI(2, 2);
data.SetValue(0, 0, 0.0);
data.SetValue(0, 1, 1.0);
data.SetValue(1, 0, 2.0);
data.SetValue(1, 1, 3.0);
|
If you want to pass large amounts of data to the grid you can also use the SetRange method:
| C# |
Copy Code
|
data.Size = new NSizeI(2, 2);
double[,] values = new double[,] { { 0.0, 1.0 }, { 2.0, 3.0 } };
data.SetRange(0, 0, values);
|
The mapped dimensions of the grid data object on the horizontal and vertical axes of the series are controlled from the OriginX, OriginY, StepX, and StepY properties of the NGridData object:
| C# |
Copy Code
|
data.OriginX = 10;
data.OriginY = 10;
data.StepX = 10;
data.StepY = 20;
|
The above code snippet maps the 2x2 grid to the range [10, 30] horizontally and [10, 50] vertically.
The heat map chart has an associated palette that is accessible from the Palette property. The code below assigns a two-color palette that colors the values in the heat map matrix from Red to Green:
| C# |
Copy Code
|
heatMap.Palette = new NTwoColorPalette(NColor.Red, NColor.Green);
|
The heat map series can also show contour lines that display areas in the heat map matrix with equal value. To show contour lines for different palette value levels you need to first assign a proper palette - usually, this is an instance of the NColorValuePalette which associates a color with a specified value:
| C# |
Copy Code
|
heatMap.Palette = new NColorValuePalette(new NColorValuePair[] { new NColorValuePair(0.0, NColor.Purple),
new NColorValuePair(1.5, NColor.MediumSlateBlue),
new NColorValuePair(3.0, NColor.CornflowerBlue),
new NColorValuePair(4.5, NColor.LimeGreen),
new NColorValuePair(6.0, NColor.LightGreen),
new NColorValuePair(7.5, NColor.Yellow),
new NColorValuePair(9.0, NColor.Orange),
new NColorValuePair(10.5, NColor.Red) });
|
Then you need to enable contour lines using the ContourDisplayMode property:
| C# |
Copy Code
|
heatMap.ContourDisplayMode = ENContourDisplayMode.Contour;
|
The following table shows the available options:
| ENContourDisplayMode |
Description |
| None |
Contour lines are not shown. This is the default. |
| Contour |
Displays the connected contours. |
| Dots |
Displays the contour points as dots. The dot size is controlled by the ContourDotSize property. |
When contour lines are visible you can also control their stroke and color. This is achieved from the ContourStroke and ContourColorMode properties. The latter accepts values from the ENContourColorMode enum:
| ENContourColorMode |
Description |
| Uniform |
The contours are displayed with stroke style taken from the ControurStroke property. |
| Palette |
The contours are displayed with stroke style taken from the ControurStroke property and color taken from the associated palette for the specific contour level value. |