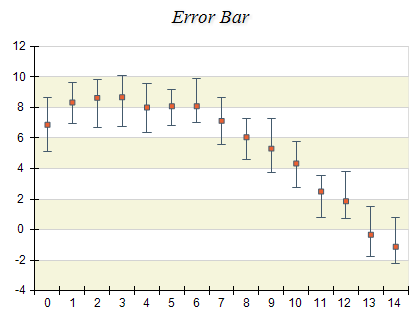
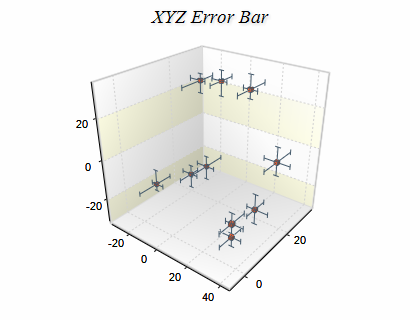
The Error Bar chart is typically used to display values and their estimated uncertainty or error. The error values are shown as "T"' shaped symbols ("whiskers") extending from the bar central point that represents the value. The Error Bar chart can display X, Y and Z error values. The following images show typical 2D and 3D error bar charts:
Creating an Error Bar Series
Error Bar series are represented by the NErrorBarSeries type. An instance of this type must be added to the series collection of a Cartesian chart:
| C# |
Copy Code
|
NErrorBarSeries errorBar = new NErrorBarSeries();
chart.Series.Add(errorBar);
|
Error bar series accept data points of type NErrorBarDataPoint. The following code snippet shows how to add data to an error bar series:
| C# |
Copy Code
|
NErrorBarDataPoint errorBarDataPoint = new NErrorBarDataPoint();
errorBarDataPoint.Value = 10;
errorBarDataPoint.X = 10;
errorBarDataPoint.UpperXError = 12;
errorBarDataPoint.LowerXError = 8;
errorBarDataPoint.UpperYError = 12;
errorBarDataPoint.LowerYError = 8;
errorBar.DataPoints.Add(errorBarDataPoint);
|
Controlling the Visibility and Size of the Error Bars
The Error Bar series is able to display errors for the X, Y, and Z dimensions. The visibility of the errors can be controlled thorough the following properties:
ShowLowerErrorX and ShowUpperErrorX control the visibility of the X-dimension error bar whiskers.
ShowLowerErrorY and ShowUpperErrorY control the visibility of the Y-dimension error bar whiskers.
ShowLowerErrorZ and ShowUpperErrorZ control the visibility of the Z-dimension error bar whiskers.
The size of the error bar whiskers can be controlled through the XErrorSize, YErrorSize, and ZErrorSize properties.
The error bar series supports the following formatting commands in addition to the standard (per data point) formatting commands:
<upperxerror> - displays the upper x error.
<lowerxerror> - displays the lower x error.
<upperyerror> - displays the upper y error.
<loweryerror> - displays the lower y error.
<upperzerror> - displays the upper z error.
<lowerzerror> - displays the lower z error.