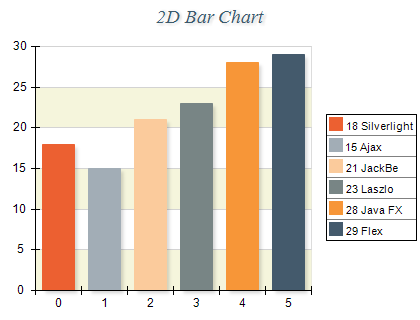
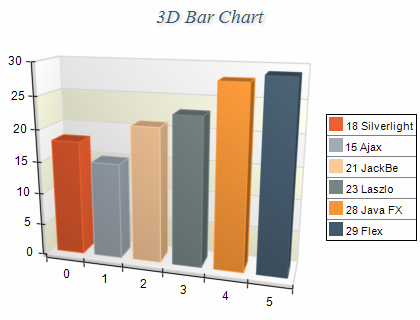
Bar charts display a sequence of horizontal or vertical bars of lengths proportional to the value that they represent. Bar charts are used to compare the values of different categories or groups of values. The following images show a typical bar, stacked, and cluster bar charts in 2D and 3D:
Bar series are represented by the NBarSeries type. An instance of this type must be added to the series collection of a Cartesian chart:
| C# |
Copy Code
|
NBarSeries bar = new NBarSeries();
chart.Series.Add(bar);
|
Bar series accept data points of type NBarDataPoint. The following code snippet shows how to add several data points to a bar series:
| C# |
Copy Code
|
bar.DataPoints.Add(new NBarDataPoint(10));
bar.DataPoints.Add(new NBarDataPoint(20));
bar.DataPoints.Add(new NBarDataPoint(30));
|
Controlling the bars origin
The bar series paints a bar that spans the bar series origin value (which is common for all bars), and the value for each individual bar data point. You can control the bar series origin value from the OriginMode and Origin properties. The following table shows the available options:
| ENSeriesOriginMode |
Description |
| CustomOrigin |
The series origin value is specified by the Origin property. |
| MinValue |
The series min value is used as a series origin. |
| MaxValue |
The series max value is used as a series origin. |
| ScaleMin |
The min scale value is used as a series origin. |
| ScaleMax |
The max scale value is used as a series origin. |
The following code snippet changes the bar origin to 10:
| C# |
Copy Code
|
bar.OriginMode = ENSeriesOriginMode.CustomOrigin;
bar.CustomOrigin = 10;
|
Controlling the bar's width and depth
The width and depth of the bars in the bar series is controlled from the WidthMode and DepthMode properties accepting values from the ENBarSizeMode enumeration. The following table lists the available options:
| ENBarSizeMode |
Description |
| Fixed |
The width or depth of the bar is fixed to the value of the Width or Depth property specified in dips. |
| Scale |
The width or depth of the bar is computed as the scaled value of the Width or Depth property. |
| MinGap |
The width or depth of the bar is dynamically computed based on the smallest distance between two adjacent bars multiplied by (1 - GapFactor). |
The following examples show how to modify the bar width:
| C# |
Copy Code
|
// bar width is 20 dips
bar.WidthSizeMode = ENBarSizeMode.Fixed;
bar.Width = 20;
// bar width is 1 category unit
bar.WidthSizeMode = ENBarSizeMode.Scale;
bar.Width = 1;
// bar width is 50 of the minimum gap between two adjacent bars
bar.WidthSizeMode = ENBarSizeMode.MinGap;
bar.WidthGapFactor = 0.5;
|
Modifying the bar depth is similar with the exception that you must modify DepthSizeMode, Depth, and DepthGapFactor properties respectively.
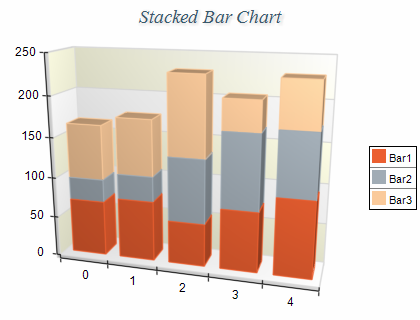
Creating a Stacked Bar Chart
A stacked bar chart displays several series stacked so that there is a single column for each category. The height of each column is determined by the total of all series values for the category. Stacked bar charts are displayed with several NBarSeries objects. The MultiBarMode property of the first bar series must be set to ENMultiBarMode.Series. The MultiBarMode property of the subsequent bar series must be set to ENMultiBarMode.Stacked or ENMultiBarMode.StackedPercent. The following example demonstrates how to create a stack bar chart with two series:
| C# |
Copy Code
|
NBarSeries bar1 = new NBarSeries();
NBarSeries bar2 = new NBarSeries();
bar1.MultiBarMode = ENMultiBarMode.Series;
bar2.MultiBarMode = ENMultiBarMode.Stacked;
|
When a bar series is stacked it is always displayed with origin 0.
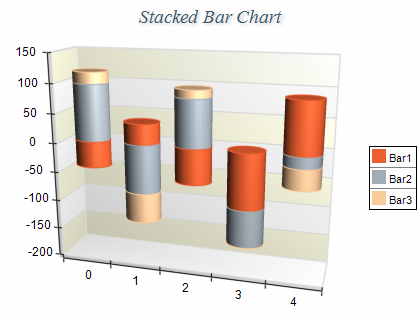
Stacked bar charts support negative values, which means that if you specify negative values for individual bar data points their respective stacks will be piled below zero. In this case, since the values for a certain category can be both positive and negative the chart will display two piles for each category - one for the positive values which grows above the zero and another one for the negative values which grows below zero. The following image shows a stacked bar that contains negative stack values.
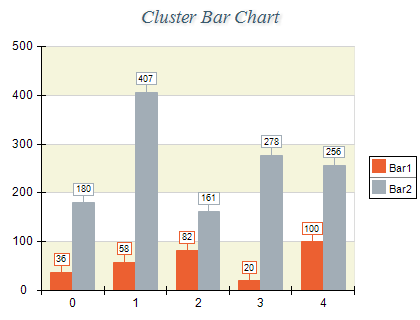
Creating a Cluster Bar Chart
Cluster Bar charts are composed of several bar series. The data points from the same category are displayed side-by-side, forming "clusters" along the X axis. This representation is convenient when you need to compare the Y values for a given category or X value. Cluster bar charts are displayed with several NBarSeries or objects. The MultiBarMode property of the first bar series must be set to ENMultiBarMode.Series. For the subsequent series the MultiBarMode property must be set to ENMultiBarMode.Clustered. The following example demonstrates how to a create cluster with two series:
| C# |
Copy Code
|
NBarSeries bar1 = new NBarSeries();
chart.Series.Add(bar1);
NBarSeries bar2 = new NBarSeries();
chart.Series.Add(bar2);
bar1.MultiBarMode = ENMultiBarMode.Series;
bar2.MultiBarMode = ENMultiBarMode.Clustered;
|
Creating a Cluster Stack Bar Chart
You can also create a cluster stack bar chart. In this case each bar series which must be part of a cluster must have the MultiBarMode property set to ENMultiBarMode.Cluster and each stacked bar series inside the cluster must have the MultiBarMode property set to ENMultiBarMode.Stacked:
| C# |
Copy Code
|
NBarSeries bar1 = new NBarSeries();
chart.Series.Add(bar1);
NBarSeries bar2 = new NBarSeries();
chart.Series.Add(bar2);
NBarSeries bar3 = new NBarSeries();
chart.Series.Add(bar3);
bar1.MultiBarMode = ENMultiBarMode.Series;
bar2.MultiBarMode = ENMultiBarMode.Clustered;
bar3.MultiBarMode = ENMultiBarMode.Stacked;
|
The bar series can have an associated palette, in which case the Fill properties of the series / data points is discarded. The following code snippet shows how to apply a palette filling to a bar series:
| C# |
Copy Code
|
bar.Palette = new NTwoColorPalette(NColor.Red, NColor.Green);
|
The bar series supports the following formatting commands in addition to the standard (per data point) formatting commands:
<total> - displays the absolute sum of the values in the current stack.
<cumulative> - displays the sum of the values up to the current stack value.
<percent> - displays the percent contribution of the value to the total pile sum.